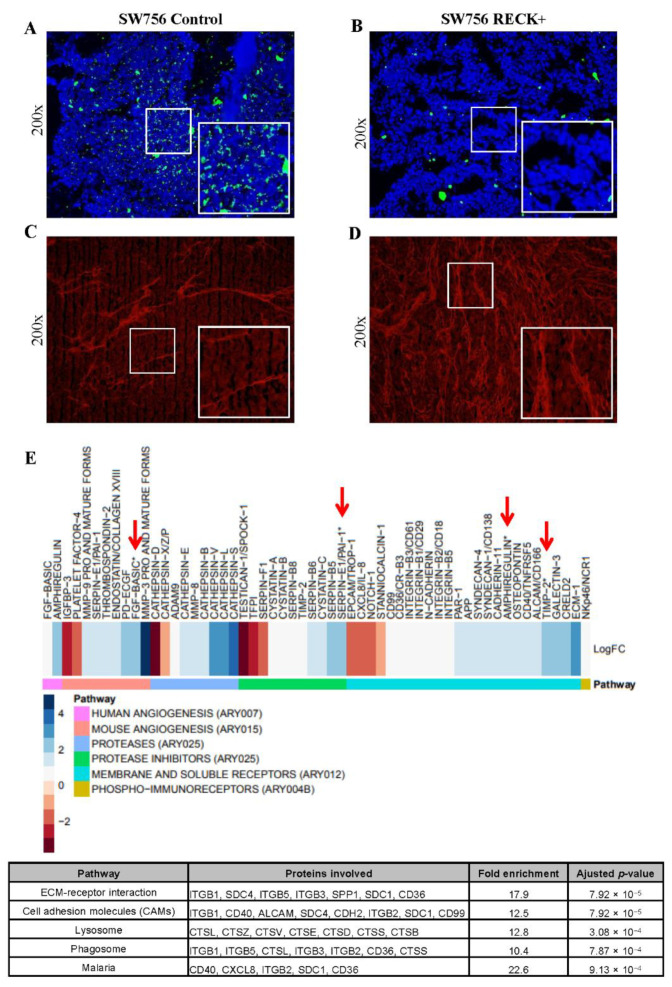
Figure 5.
SW756 RECK+ tumors present collagenase activity, higher collagen content and increased levels of collagenase inhibitors. (A,B). In situ zymography assay carried out with SW756 tumors using DQ Collagen IV (green signal represents collagen breakdown). (C,D) Representative images showing Picro Sirius fluorescent staining of SW756 tumors (red signal shows collagen fibers). All fluorescent assays were carried out in the presence of DAPI staining and the merged images were processed using Image J software. (E). Heatmap representation of differentially expressed proteins in RECK+ tumors when compared to control. The fold change is expressed in log2 scale; where blue and red scale represents increased and decreased relative expression, respectively. Antibody arrays were depicted in different colors on the far-left side, below the heatmap. Proteins were identified as differentially expressed when fold change, expressed in log2, was over 0.58 or under −0.58. Red arrows show differentially expressed proteins detected in more than one antibody array. The table displays the enrichment analysis in KEGG pathway database with use of DAVID web tool. Statistical analysis was performed with Fisher’s exact test (bottom).

