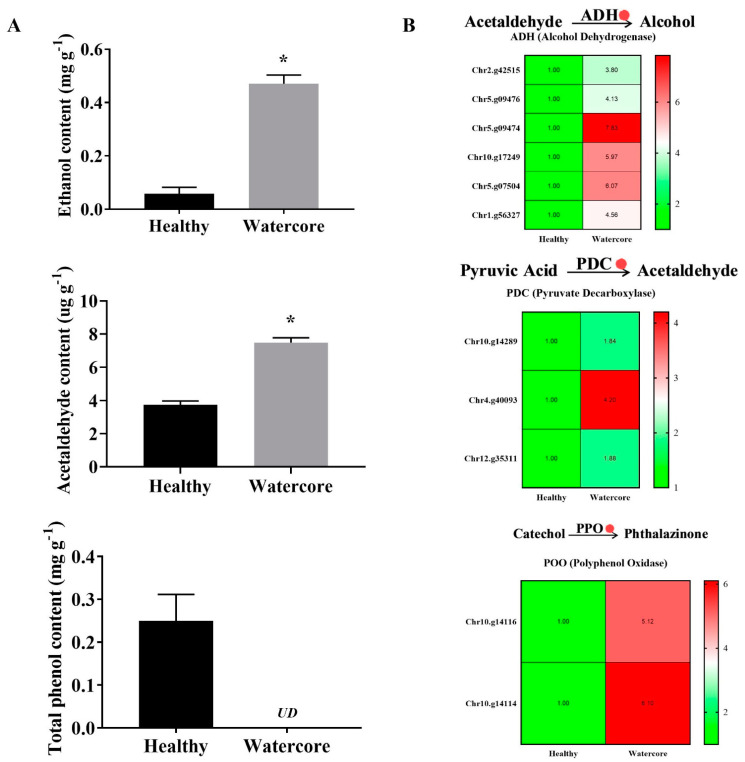
Figure 4.
Analysis of ethanol, acetaldehyde and total phenols content (A) and their metabolism-related gene expressions (B) in watercore fruit. The red circle refers to the up-regulation of gene expression. The asterisk on the bars indicates significant differences between the watercore and healthy fruit at p < 0.05. UD: Not detected.

