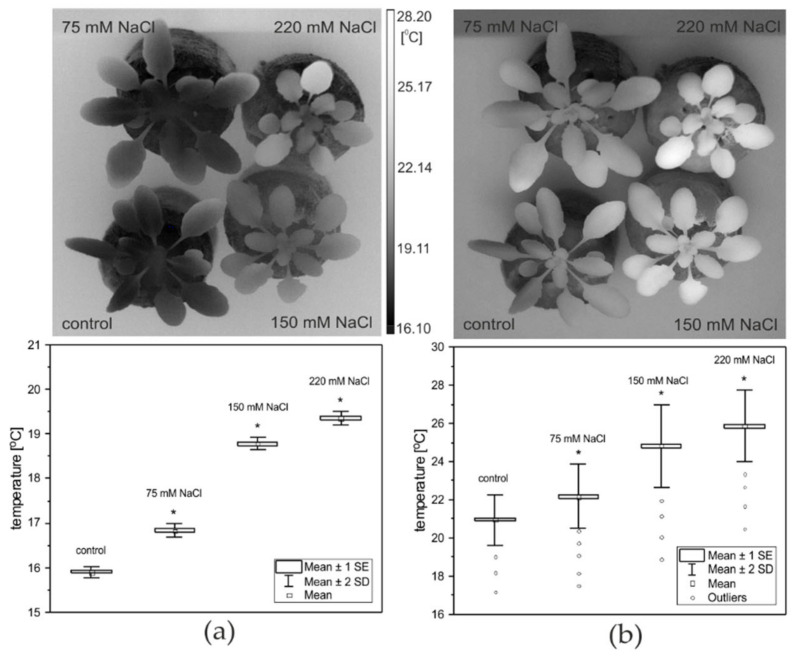
Figure 4.
Infrared thermograms of LL-growing (a) and HL-treated (b) A. thaliana plants acquired three days after exposure to salinity (upper panel), and the average temperature distribution over the leaf rosettes of control and salt-treated plants (lower panel). Data are presented as box-and-whisker plots showing mean, standard error, and the outliers at the 95% confidence level. An asterisk (*) indicates significant differences (p ≤ 0.05, ANOVA test) between the non- and salt-treated plants before (LL) and after an acute HL treatment.

