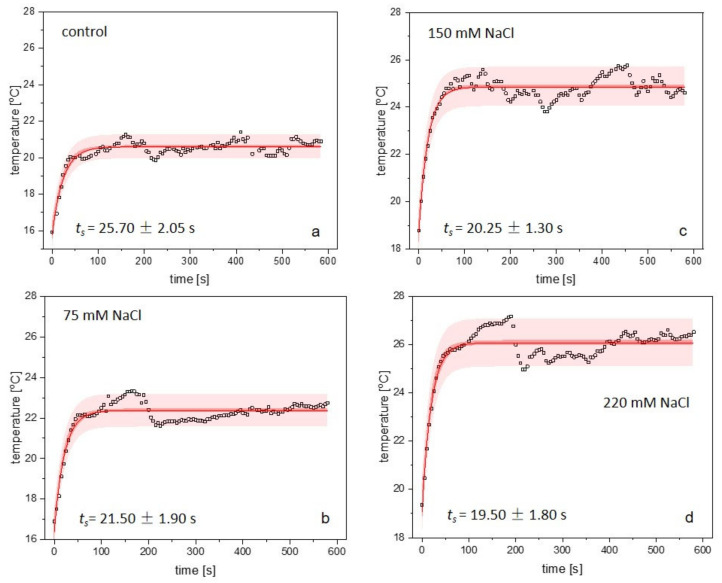
Figure 5.
Changes in the temperature of rosette leaves induced by an acute HL treatment measured in A. thaliana plants exposed to salinity. Each point on the graph represents the mean value of at least three randomly chosen spots on the thermal image for control (a), 75 (b), 150 (c), and 220 mM (d) NaCl treatments. The thermal kinetics were fitted using a mono-exponential function, y = y0 + ys·[1 − exp(−t/ts)]. Theoretically determined courses approximate the initial responses of plants to excess light three days after exposure to salinity. Each graph (a–d) shows the fitted thermal data along with 95% prediction (light red surfaces) and confidence (dark red surfaces) bands. The light intensity was 2000 µmol·m−2·s−1.

