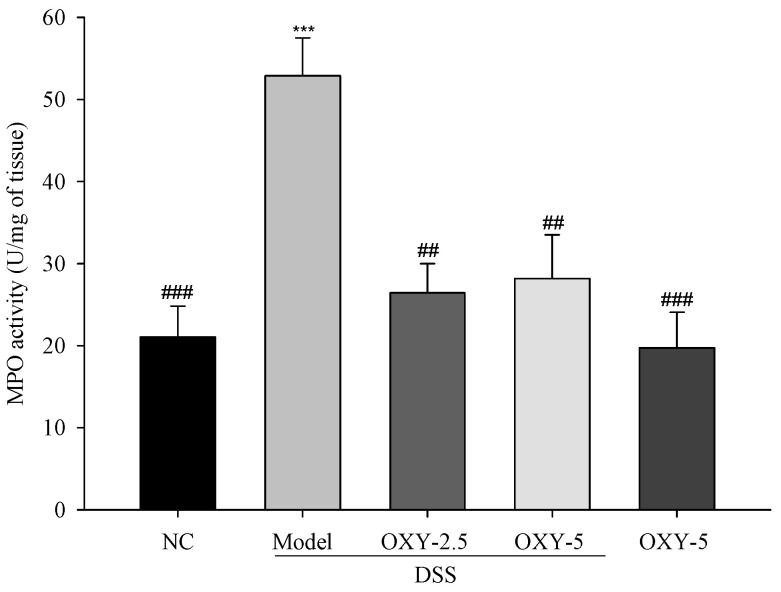
Figure 4.
The effect of OXY on myeloperoxidase (MPO) activity (n = 8/group). MPO activity in colon tissue was measured and normalized to colon fraction weight. NC, normal control group; model, DSS-induced colitis model group; DSS + OXY-2.5, DSS-induced colitis rats treated with OXY (2.5 mg/kg) group; DSS + OXY-5, DSS-induced colitis rats treated with OXY (5 mg/kg) group; OXY-5, rats treated with OXY (5 mg/kg) alone group. The values are expressed as mean ± SEM. Significant differences among groups were evaluated via ANOVA with Tukey’s post hoc HSD. *** p < 0.001 compared with the NC group; ## p < 0.01 and ### p < 0.001 compared with the model group.

