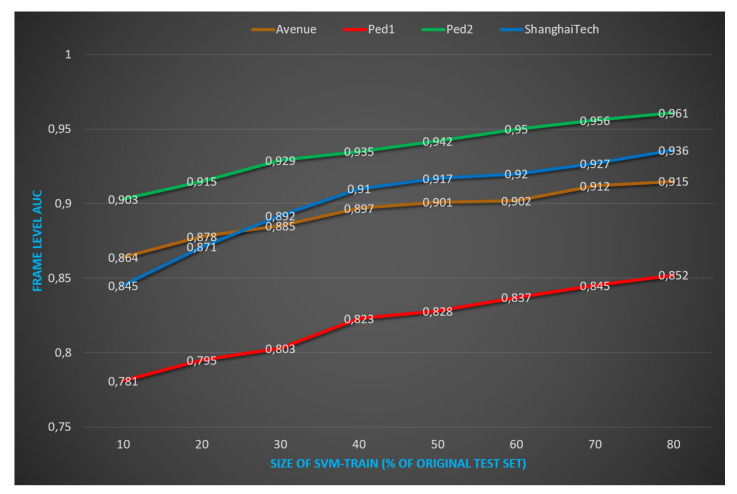
Figure 6.
Evolution of AUC performance according to the size of SVM-train set. The vertical axis shows the AUC performances and the horizontal axis shows the size of SVM-train set corresponding to how many samples of the original test set. By increasing sequentially the SVM-train set size from 10% of the original test set size up to 80%, we report the evolution of performance. Obviously, the larger the size of SVM-train set we create, the better performance we obtain. Considering the effect of supervised scenario, we show that from 50% of the original test set size, we surpass state-of-the-art performance on Avenue, Ped1, and ShanghaiTech. Best viewed in color.

