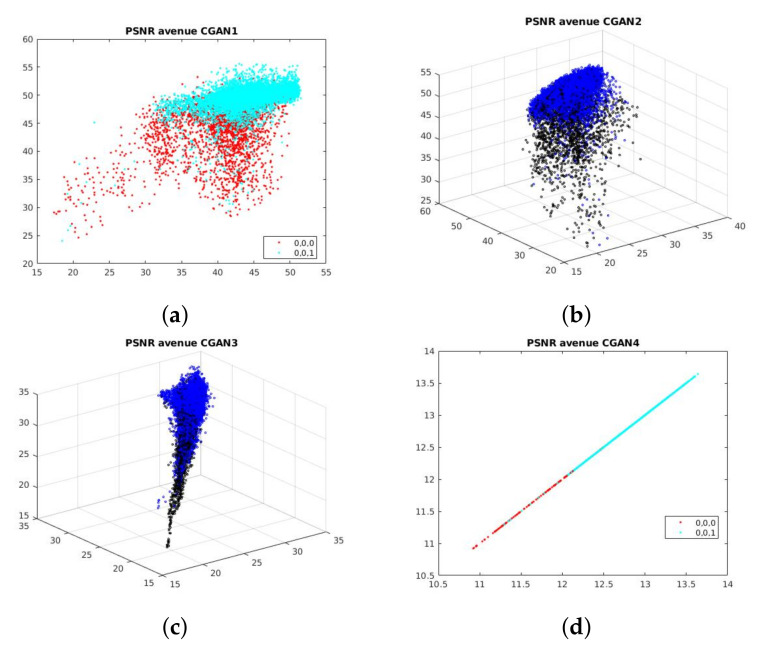
Figure 7.
Distribution of normal and abnormal samples in Avenue dataset. For CGAN-2 (b) and CGAN-3 (c), normal points are blue and abnormal points are black. For CGAN-1 (a) and CGAN4 (d), normal = light blue and abnormal = red. Obviously, normal samples situate in higher values than abnormal ones. This distribution corresponds to the fact that PSNR techniques produce high scores if predicted images tend to similar source images. On one side, because Avenue contains RGB images, CGAN-3 has 3-dimensions values.

