Figure 5.
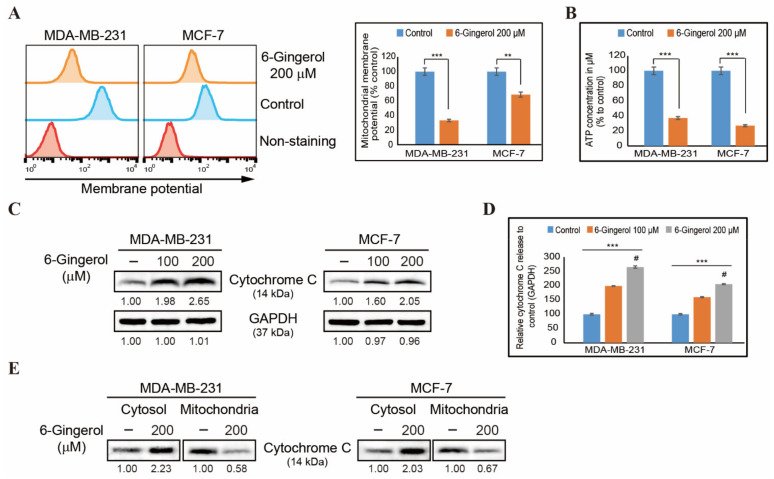
6-Gingerol induces the release of cytochrome c. (A) Flow cytometry analysis in MDA-MB-231 and MCF-7 cells after treatment with 6-gingerol for 48 h showing mitochondrial membrane potential and the resulting decrease in membrane potential. The values are presented as means ± SEM of three independent experiments performed in triplicate (n = 3). ** p < 0.01 and *** p < 0.001 (Student’s t-test). (B) Graphical representation of ATP formation induced by treatment with 200 µM of 6-gingerol in breast cancer cells. The values are presented as means ± SEM of three independent experiments performed in triplicate (n = 3). *** p < 0.001 (Student’s t-test). (C) Western blotting of MDA-MB-231 and MCF-7 cells after 48 h treatment with 100 and 200 µM of 6-gingerol showing the expression of cytochrome c. (D) Representative expression of proteins was determined by densitometry and normalized to GAPDH. Controls are set to 100. Data were confirmed after repeating the experiment three times. *** p < 0.001 (ANOVA test). # p < 0.001 vs. control. (E) Western blotting analysis in cytosolic and mitochondrial fractions isolated from MDA-MB-231 and MCF-7 cells after 48 h treatment with 200 µM of 6-gingerol showing the expression of cytochrome c protein.

