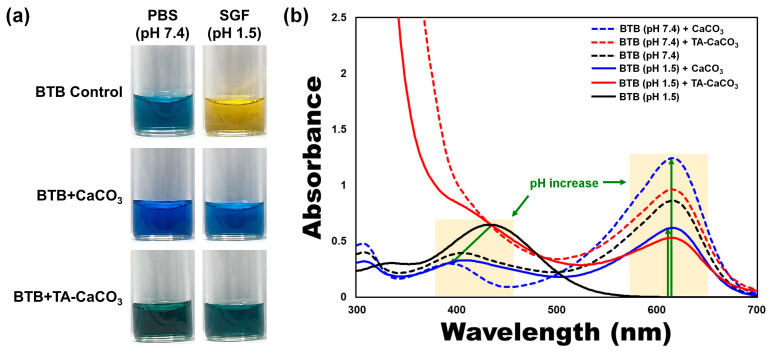
Figure 5.
Antacid effects of TA-CaCO3 using the colorimetric bromothymol blue (BTB) method. (a) Color changes and (b) UV/vis spectra of BTB under PBS (pH = 7.4) and simulated gastric fluid (SGF, pH = 1.5) after treatment with commercial CaCO3 and 1:75 TA-CaCO3. Green-colored arrows indicate a pH increase.

