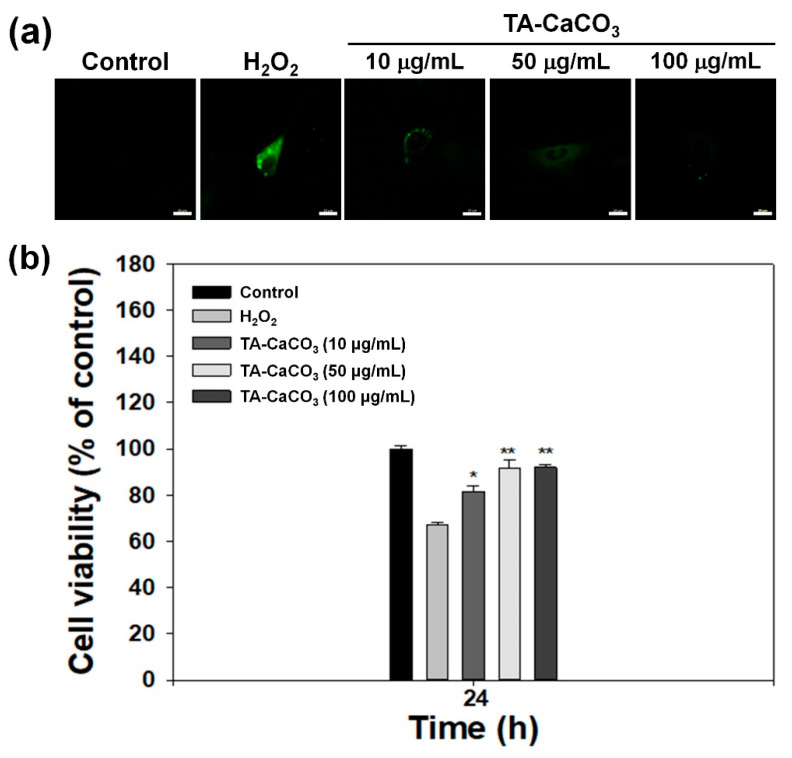
Figure 8.
In vitro antioxidant effects of TA-CaCO3. (a) Representative fluorescence images of intracellular ROS in chondrocytes treated with extracts containing different concentrations of 1:75 TA-CaCO3 for 24 h after pretreatment with 300 μM of H2O2 for 30 min. Scale bar: 20 μm. (b) Viability of chondrocytes treated with different concentrations of 1:75 TA-CaCO3 for 24 h after pretreatment with 300 μM of H2O2 for 30 min. Results are expressed as the mean ± SD (n = 5). ** p < 0.01 and * p < 0.05.

