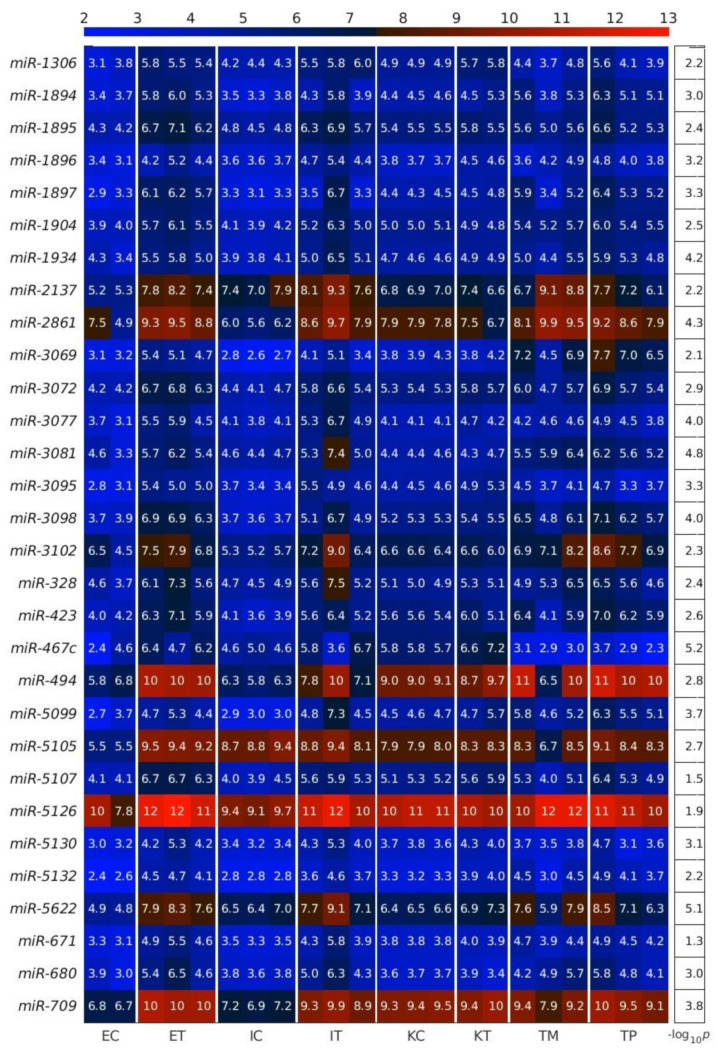
Figure 4.
Upregulated miRNAs between the control and the tumor microenvironment (TME) cells. Heatmap of the expression of the differentially expressed miRNAs (DEMs) in lexicographic order of the miRNA names. The color bar codifies the miRNA expression in log2 scale. Higher miRNA expression corresponds to redder color. The −log10 (p-value) of the DEMs are presented in a table to the right of the heatmap. The samples are denoted with E, I and K for endothelial, Ito and Kupffer cells, C and T for the control and the TME cells, and TP and TM for colorectal cancer (CRC) primary and liver metastasis cells, respectively.

