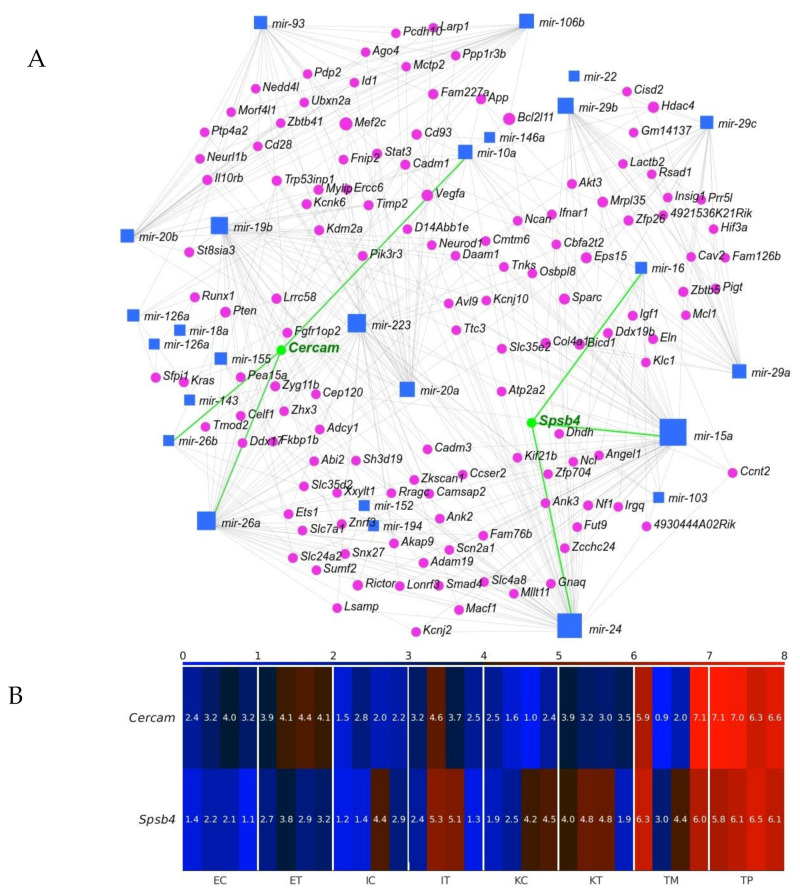
Figure 9.
Interaction between geromiRs downregulated in the tumor microenvironment (TME) cells and their gene targets. (A) Network of the geromiRs downregulated in the TME cells and their gene targets. The blue squares mark geromiRs and the magenta circles mark gene targets. The gene names in green, Cercam and Spsb4, mark the gene targets upregulated in the TME cells in relation to the healthy control cells, and the green lines, their connections with their associated geromiRs. (B) Heatmap of the expression of the gene targets upregulated in the TME cells. The color bar codifies the miRNA expression in log2 scale. Higher miRNA expression corresponds to redder color. The samples are denoted with E, I and K for endothelial, Ito and Kupffer cells, C and T for the control and the TME cells, and TP and TM for colorectal cancer (CRC) primary and liver metastasis cells, respectively.

