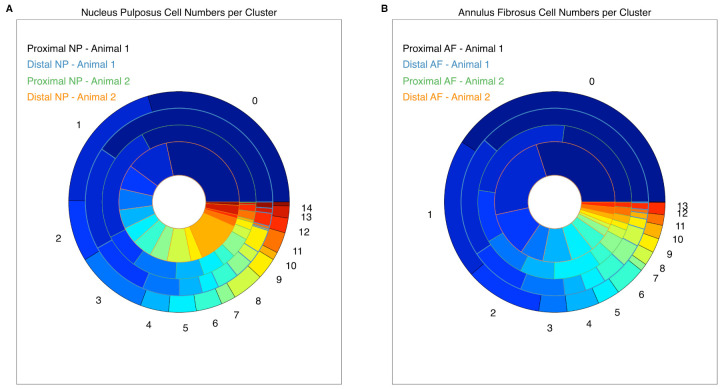
Figure 2.
Cell cluster size correlation. The graphical alignment of cell cluster sizes within the NPs (A) and the AFs (B) shows a high correlation (r > 0.85) within the datasets. The numbers placed around the piechart are cell cluster numbers, with the largest cluster starting at number zero. Each ring represents one sample and each color within the ring represents one cluster.

