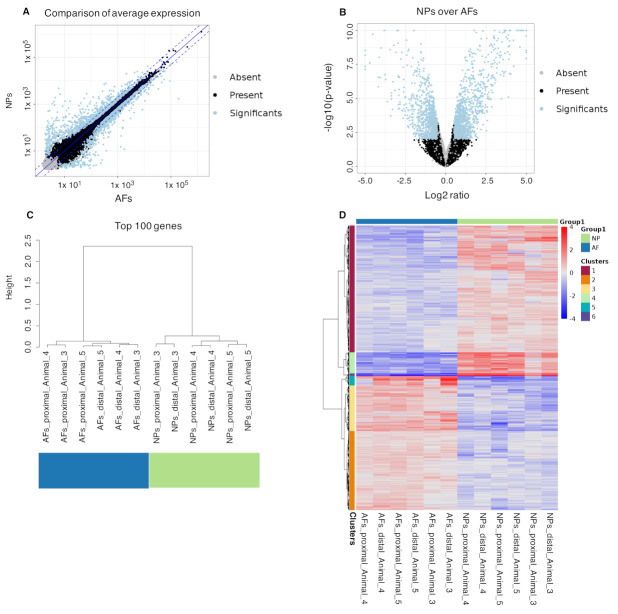
Figure 6.
Comparison between NPs and AFs in the bulk RNAseq data. In the correlation graphic (A) is present a light correlation in the gene expression between all the (6) NPs and (6) AFs, with relevant differences. The volcano plot (B) shows a high number of significant differentially expressed genes with relevant fold changes between NPs and AFs. The dendrogram (C) compares the top 100 most expressed genes in the NPs and AFs. This shows a clear distinction between the gene expression of the NPs and the AFs, that clustered separately. Intra group, the NPs samples cluster per animal. In the AFs, instead, Animal 5 clustered together, while, for the Animals 3 and 4, the clustering occurs between the two proximal and the two distal samples. The heat map (D) shows a very clear distinction in the gene expression pattern of the NPs over the AFs. Here, the gene Clusters 1, 4 and 6 are upregulated in the NPs, while the gene Clusters 2, 3 and 5 are downregulated.

