
Figure 7.
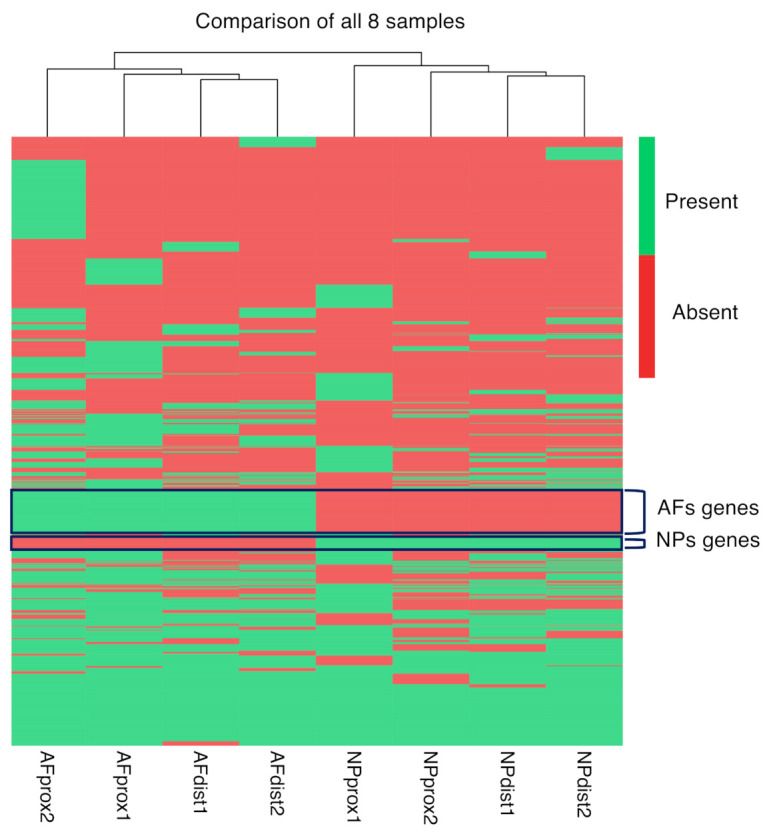
Heat map scRNAseq. Heat map depicting the presence and absence of expressed genes (top cluster markers) in the proximal and distal AFs and NPs of Animals 1 and 2, scRNAseq data. The gene clusters that are expressed exclusively in AFs and NPs are of particular interest as potential markers.