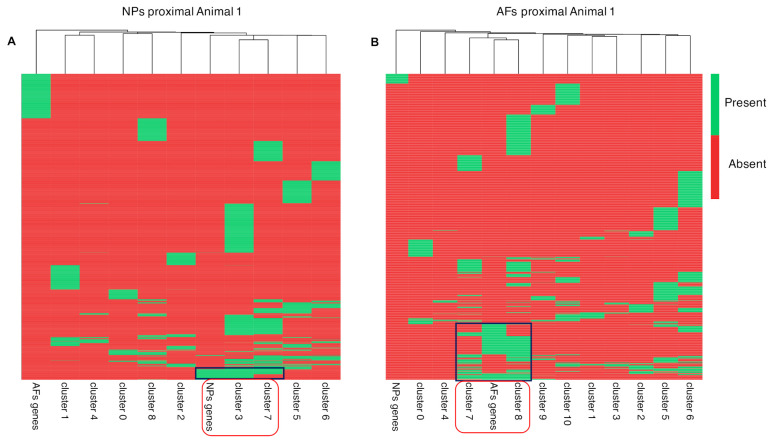
Figure 8.
Heat map scRNAseq cluster. Heat map of exclusive AF and NP genes in the scRNAseq data, expressed in the NPs proximal and and AFs proximal of Animal 1. (A) The first heat map depicts the cell clusters that express NP genes. (B) The second heat map depicts cell clusters that express AF genes. The dendrogram at the top is a function of the amount of commonly expressed genes.

