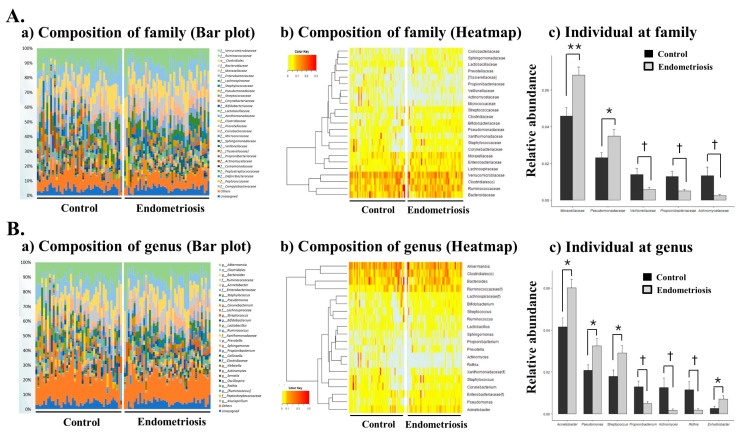
Figure 3.
Microbial composition of the peritoneal fluid in the control and endometriosis groups at the family and genus levels. (A) (a,b) microbiome composition at the family level (Bar plot and Heatmap) (c) individual microbiome at the family level; (B) (a,b) microbiome composition at the genus level (Bar plot and Heatmap) (c) individual microbiome at the genus level. * p < 0.05, ** p < 0.001, † p < 0.05, respectively.

