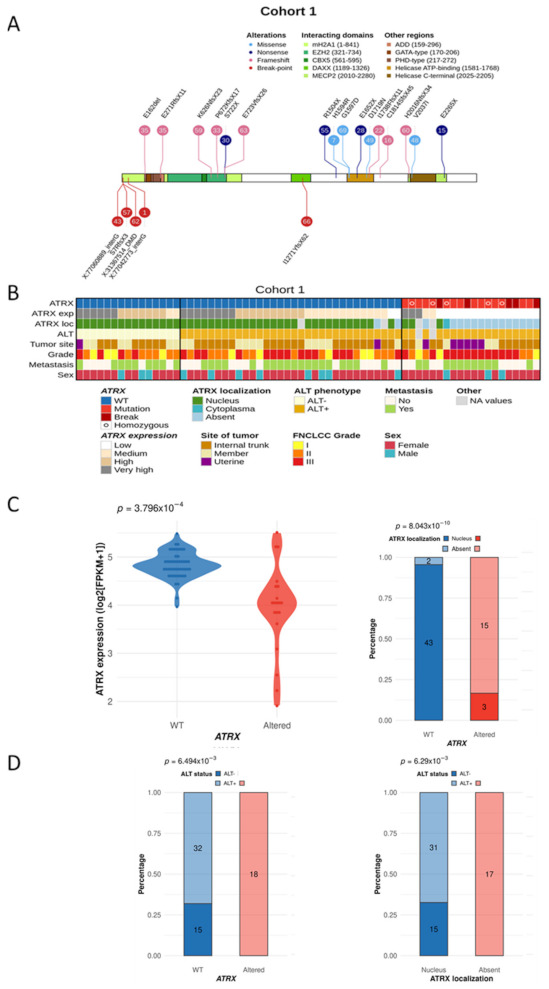
Figure 1.

ATRX status and integrated representation in leiomyosarcomas. (A) ATRX alterations are color-coded according to their type (legend at the top). Numbers in bubbles represent tumor samples. Consequences of all point mutations on ATRX protein are annotated above a schematic representation of the protein, or below for two structural variants (LMS57 and LMS66). For the other three structural variants, annotations correspond to the break-point partner in genomic coordinates. (B) The integrated representation shows ATRX alterations, ATRX mRNA expression (by quartile), ATRX localization, ALT mechanism phenotype, tumor site, FNCLCC grade, presence or not of metastasis, and sex of each patient. Tumors are ordered by ATRX status, ALT phenotype, mRNA expression, and protein localization. (C) Association between ATRX alteration and its mRNA expression (log2 (FPKM + 1)) (left) or its protein localization (right). (D) Relation between ATRX status (left) or its protein localization (right) and ALT mechanism phenotype. For ATRX localization, the “absent” group means “not at the nucleus”, including all cases without expression and the case with a cytoplasmic localization (LMS16). p-values were calculated with Student test for (C)—left and with Fisher test for (C)—right and (D).
