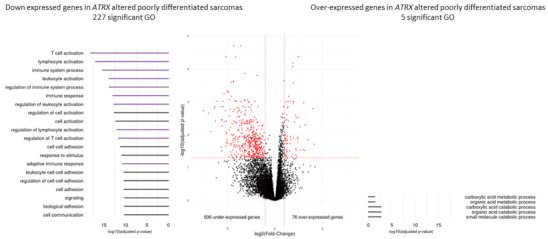
Figure 4.

Differential gene expression and Gene Ontology analyses according to ATRX status (wild-type vs. altered) in poorly differentiated pleomorphic sarcomas (Cohort 2). Differentially expressed genes in ATRX-altered tumors are represented in red (p ≤ 0.05 and fold-change ≤−2 or ≥2). Gene Ontology (GO) analyses, represented on the left (under-expressed genes) and the right (over-expressed genes), identified 227 and five significant GO terms (p ≤ 0.05), respectively. On the left, the 20 most significant GO terms are represented and color-coded by mechanism; purple and black groups indicate “immunity system process” and general terms, respectively. All p-values were adjusted by Benjamini and Hochberg method.
