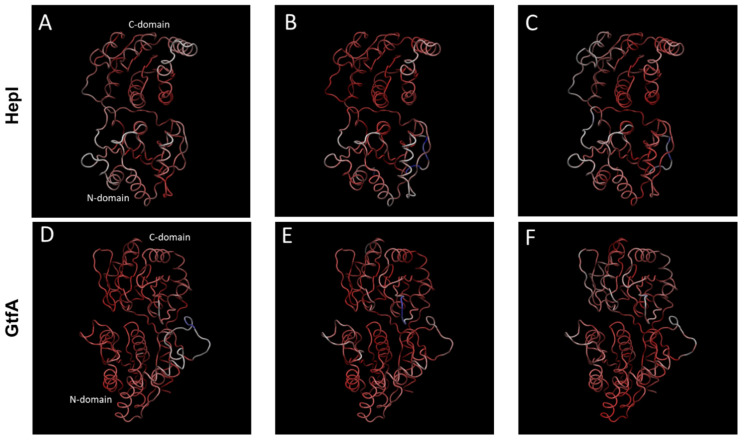
Figure 3.
The first three principal components of quasiharmonic motions sampled by the 1.2 μs molecular dynamics trajectories for HepI (A–C) and for GtfA (D–F) (see Supplementary Figure S5 for animation). HepI and GtfA domains, C-domain, N-domain, and linker region are represented by white, blue, and green ribbons, respectively. These three large amplitude components account for 60.1 and 50.5% of dynamic motions, respectively, for HepI (top) and GtfA (bottom).

