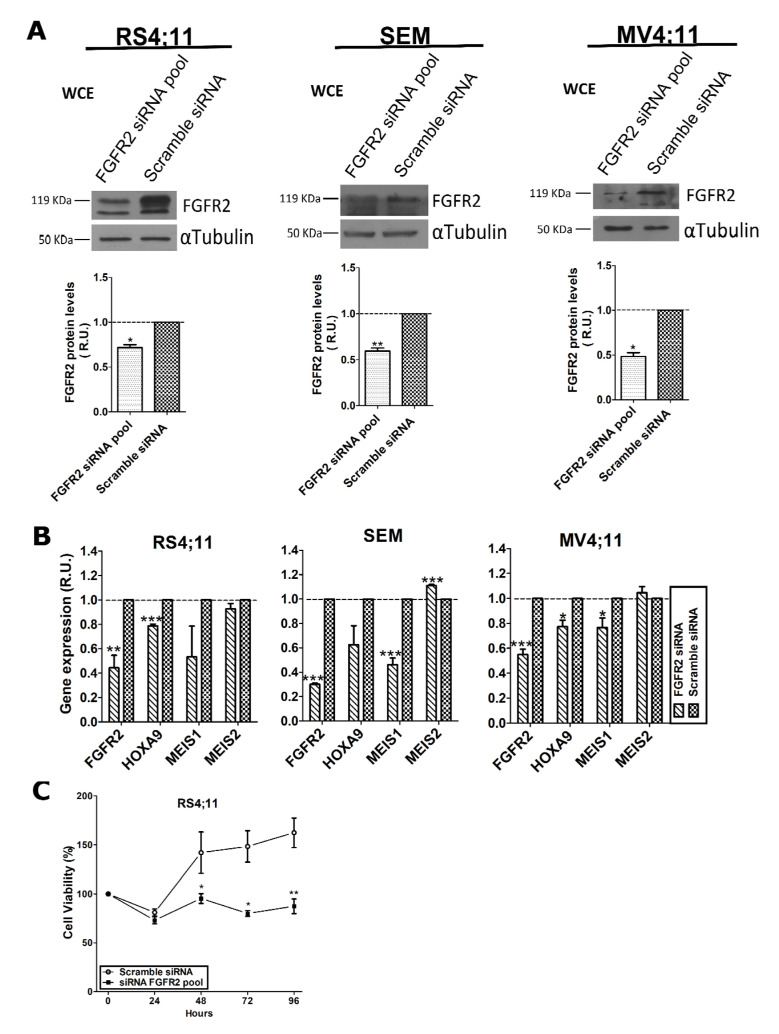
Figure 2.
FGFR2 affects transcription of MLL-AF4 target genes in three t(4;11) cell lines. (A) Western blot analysis of total proteins (WCE) extracted 72 h after transfection with FGFR2-siRNA pool carried out with anti-FGFR2 antibody to evaluate residual FGFR2 amount; scramble siRNA represents the negative control; α-tubulin was used to normalize protein loading. (B) RT-qPCR analysis of FGFR2, HOXA9, MEIS1, and MEIS2 transcript levels in FGFR2-silenced cells. Average values from at least three independent experiments are graphically reported as relative units (R.U.). Relative gene expression was normalized to ACTB, POLR2A, and TUBA1A genes and expression levels were determined using the 2−ΔΔCt method. Statistical significance was calculated by one-way two-tail paired t-test. p-values are indicated as follows: * = p < 0.05; ** = p < 0.01; *** = p < 0.005. (C) Cell viability determined by MTT assay at 0, 24, 48, 72, and 96 h after transfection of cells with a FGFR2 siRNA pool and with scramble siRNA as a control. R.U., relative units.

