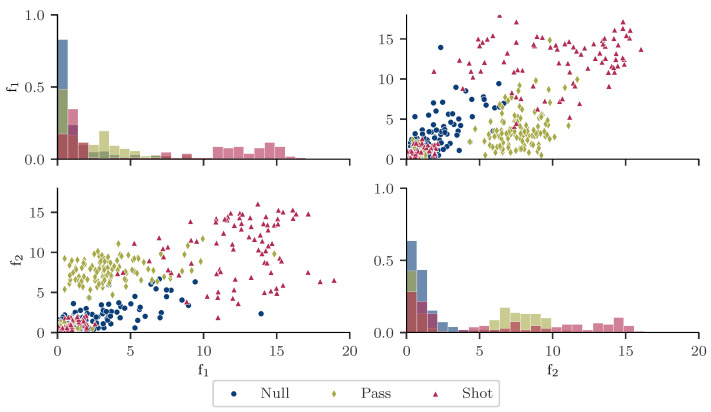
Figure 3.
Histograms and scatter plots for two exemplary features: The absolute sum of the accelerometer x-axis during the kick phase (f) and the absolute sum of the accelerometer y-axis during the kick phase (f). Only shots, medial passes and light ball contacts from 2 random laboratory training sessions are considered. The histograms are constructed with 25 bins and show frequency density. In addition, the sum of the bars of each histogram is normalized and bars for different classes are stacked.

