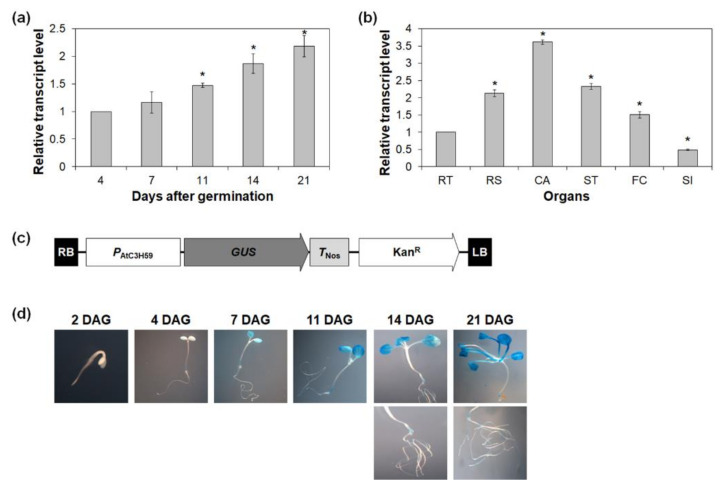
Figure 2.
Temporal and spatial expression patterns of AtC3H59. (a) Quantitative RT-PCR analysis of AtC3H59 in 4-, 7-, 11-, 14-, and 21-day-old WT seedlings grown under SD conditions. GAPc was used for an internal control. Transcript level at 4 DAG was set as 1. (b) Quantitative RT-PCR analysis of AtC3H59 expression in organs of 49-day-old WT grown under LD conditions. GAPc was used for an internal control. Transcript level in RT was set as 1. RT, roots; RS, rosette leaves; CA, cauline leaves; ST, stems; FC, floral clusters; SI, siliques. (c) Schematic maps of PAtC3H59::GUS for GUS assays. (d) Histochemical assay of GUS expression in T2 transgenic Arabidopsis plants carrying PAtC3H59::GUS at different developmental stages grown under SD conditions. Representative GUS staining results are shown here. In (a,b), three independent reactions were performed for each technical replicate. Two technical replicates were performed for each biological replicate. Data shown are the mean ± S.D. (n = 6). At least two biological replicates showed similar results, with one shown here. * indicate t-test p < 0.05.

