Figure 3.
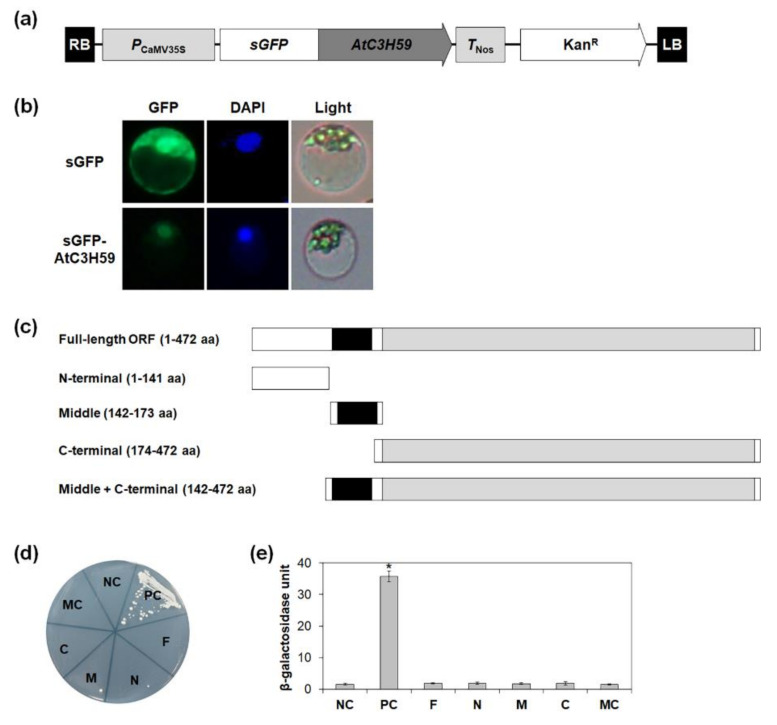
Subcellular localization and transactivation activity of AtC3H59. (a) Schematic map of sGFP-fused full-length AtC3H59 construct. (b) Subcellular localization of AtC3H59 was examined by transient expression of sGFP-AtC3H59 fusion proteins in Arabidopsis protoplasts. Left, GFP signal; middle, 4′,6-diamidino-2-phenylindole (DAPI) staining; right, light microscopic picture. (c) Schematic maps of full-length ORF of AtC3H59 and truncated fragments of AtC3H59 for analysis of transactivation activity in yeast. (d) Yeast growth assay. Yeast transformants were grown on SM-Trp/-Ura. (e) Quantitative β-galactosidase ONPG assay. The transactivation activities were quantified by measuring the β-galactosidase activity in yeast extract. The data shown are the means ± S.D. (n = 3). * t-test p < 0.05. In (d,e), pBD-GAL4 vector itself was used as a negative control. NC, negative control; PC, positive control; F, full-length ORF; N, N-terminal region; M, middle region; C, C-terminal region; MC, middle + C-terminal region.

