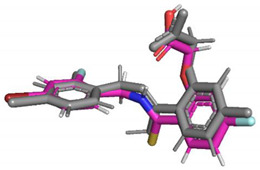
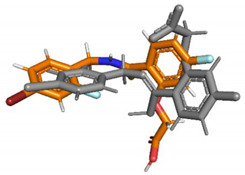
Table 3.
Comparison of RMSDs of both types of poses with respect to the crystal geometry of IDD594.
| Ligand # | Pose Type 1 | Pose Type 2 | ||
|---|---|---|---|---|
| Avg. IE (kCal·mol−1) | RMSD Crystal Geometry (Å) | Avg. IE (kCal·mol−1) | RMSD Crystal Geometry (Å) | |
| Predicted pose superimposed on crystal geometry (grey) |

|

|
||
| 10 | −107.67 | 0.223 | 2.35 | 2.042 |
| 16 | −89.93 | 0.263 | −18.68 | 2.563 |
| 19 | −121.11 | 0.137 | 18.24 | 2.128 |
| 24 | −98.39 | 0.943 | −33.42 | 2.342 |
| 25 | −100.45 | 1.180 | −19.97 | 2.603 |
