Table 5.
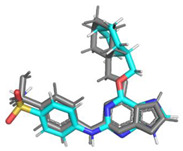
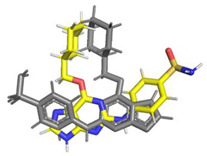
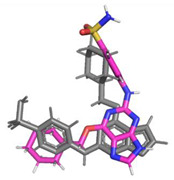
Comparison of RMSDs of the three types of predicted poses with respect to the crystal geometry of NU6102.
| Ligand # | Pose Type 1 | Pose Type 2 | Pose Type 3 | |||
|---|---|---|---|---|---|---|
| Avg. IE (kCal·mol−1) | RMSD with Crystal Geometry (Å) |
Avg. IE (kCal·mol−1) | RMSD with Crystal Geometry (Å) |
Avg. IE (kCal·mol−1) | RMSD with Crystal Geometry (Å) |
|
| Predicted pose superimposed on crystal geometry (grey) |

|

|

|
|||
| 3 | −434.26 | 0.832 | −422.08 | 4.072 | −299.76 | 3.212 |
| 25 | −304.97 | 0.944 | −258.26 | 4.379 | −219.28 | 2.947 |
| 28 | −433.67 | 0.844 | - | - | −334.16 | 3.221 |
| 29 | −434.11 | 0.798 | −376.89 | 3.797 | −376.57 | 2.752 |
| 30 | −398.53 | 0.811 | −498.35 | 3.454 | −362.61 | 2.950 |
| 33 | −432.88 | 0.567 | −414.07 | 3.680 | −317.21 | 2.908 |
| 34 | −418.00 | 0.975 | −334.12 | 3.330 | Failed | 2.875 |
