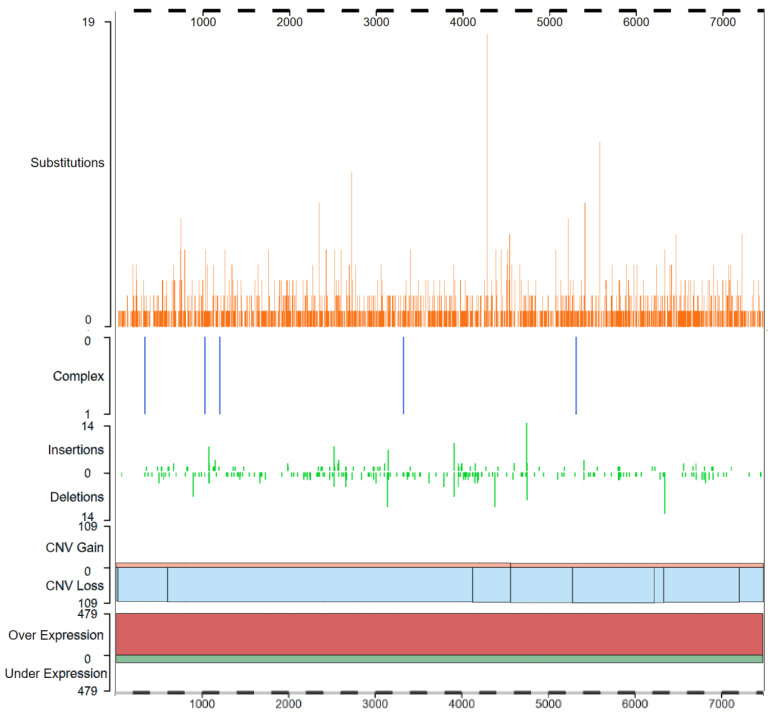
Figure 1.
ATRX mutations in cancer—The gene histogram shows the distribution of all mutations contained across the ATRX gene in 3357 cancer samples and cataloged in the COSMIC database (v92; GRCh38) https://cancer.sanger.ac.uk/cosmic/gene/analysis?coords=bp%3AAA&wgs=off&id=230763&ln=ATRX&start=1&end=2493 (accessed on 16 April 2021). From top to bottom are shown single nucleotide substitutions (orange), multinucleotide substitutions (“complex”) (blue), insertions and deletions (green), copy number gain (pink)/loss (blue), gene over (red)/under (green) expression. Gene overexpression was found in 479 samples whereas underexpression was found in 102 samples. Image modified from COSMIC database website [15,16].

