FIG 3.
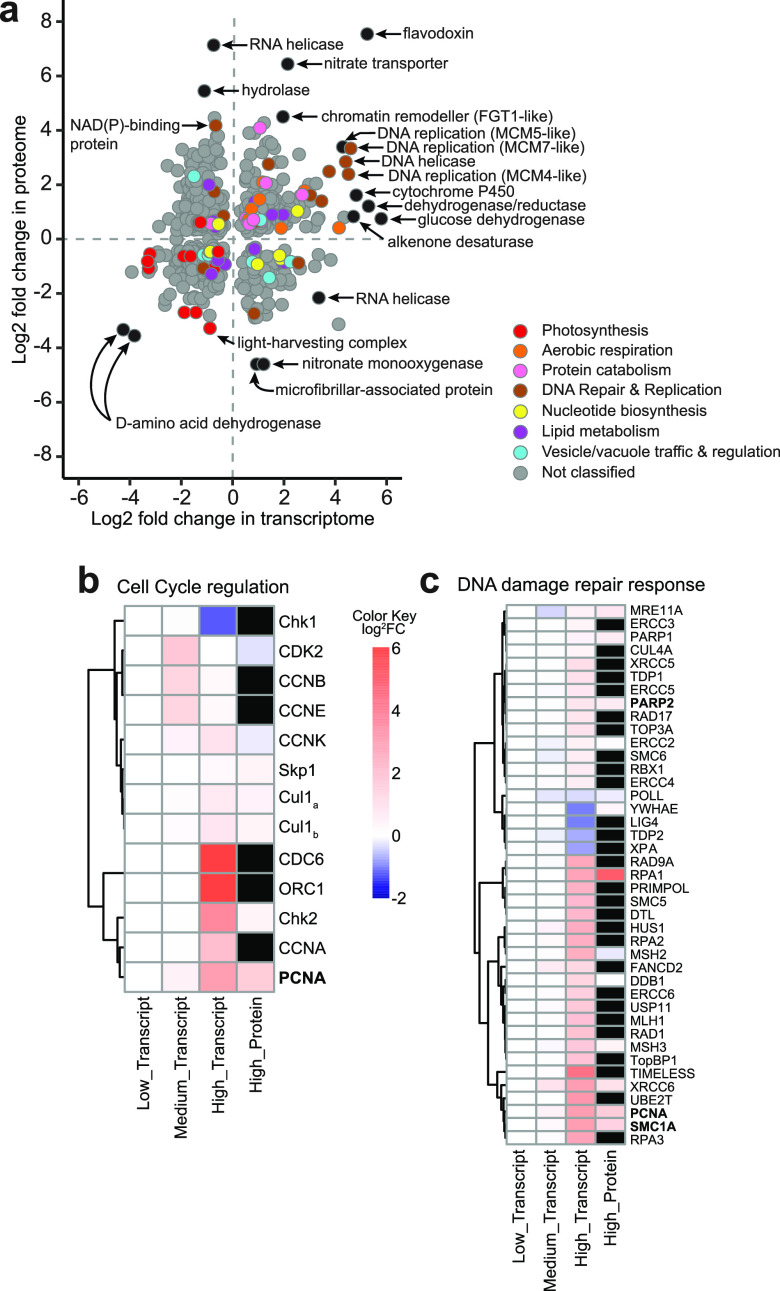
Molecular and proteomic changes as a result of HHQ exposure. (a) Comparison of log2 fold changes in transcript (x axis) and protein (y axis) expression from E. huxleyi cultures (n = 4) following exposure to 100 ng ml−1 HHQ for 72 h compared to the vehicle control (DMSO). Only shared differentially expressed transcripts (q value of <0.05 by a Wald test) and proteins (q value of <0.05 by Welch’s approximate t test) are shown for a total of 665 genes/proteins. Transcripts and proteins with similar functions are colored via gene ontology (GO) annotation according to the curated groupings shown in Supplemental Data File 1 at https://doi.org/10.6084/m9.figshare.14414285.v1. Genes and proteins without GO annotations or annotations outside the selected groupings are shown in gray. Selected outliers are labeled in black. (b and c) Heat maps displaying putative homologs of E. huxleyi protein-coding genes associated with cell cycle regulation (b) and the DNA damage repair response (c) after 72 h of HHQ exposure. Black boxes indicate proteins that were not detected in the proteomic analysis. Names in boldface type indicate those protein-coding genes found within the scatterplot in panel a. Dendrograms indicate hierarchical clustering based on the similarity of gene/protein expression levels. FC, fold change.

