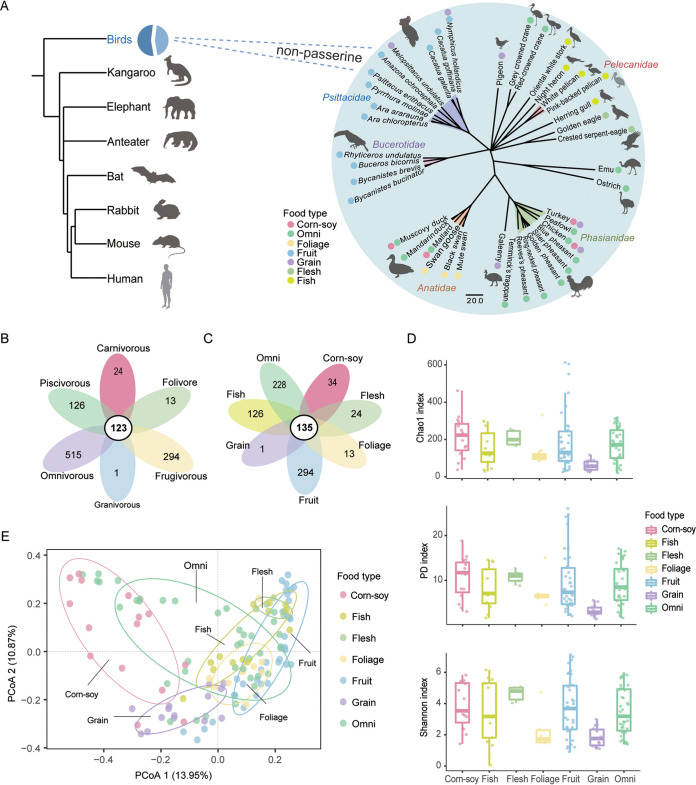
FIG 1.
Diet type influences microbial diversity. (A) Phylogenetic tree of the birds used in this study. (B) Flower plot shows shared and unique OTUs between the 6 feeding habit groups. (C) Flower plot shows shared and unique OTUs between 7 dietary type groups. (D) Differences in microbial diversity (Chao1, PD whole tree, and Shannon index) at the OTU level between 7 dietary type groups shown as box plots (t test). (E) PCoA plot based on the Bray-Curtis dissimilarities at the OTU level. Differences observed between the groups are based on the PERMANOVA test. Results show that dietary type is a predictor of microbial variance (r2 = 0.21304, P = 0.0001). Each color corresponds to a dietary type. Ellipses are at the 70% confidence level.

