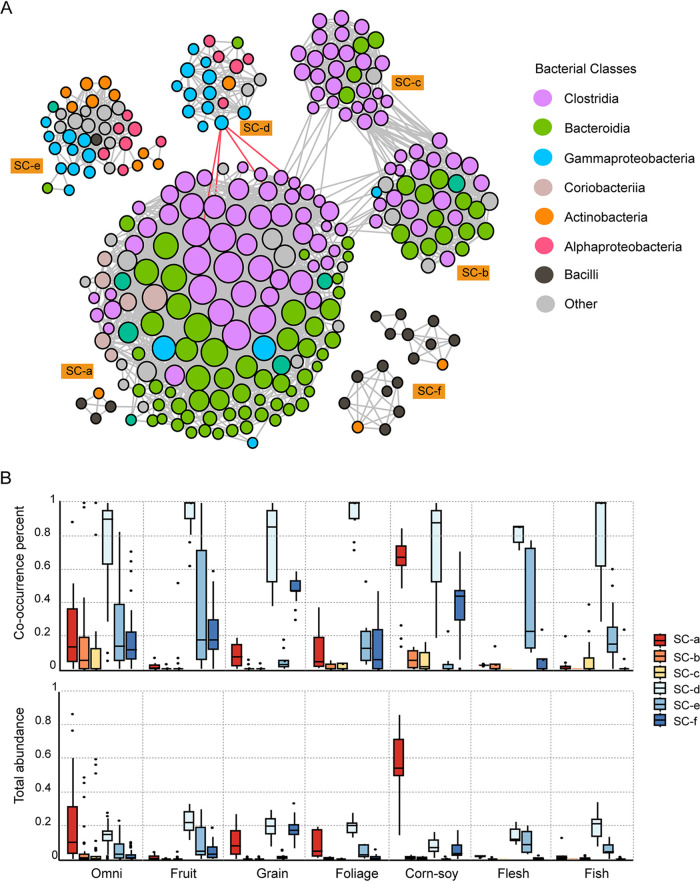
FIG 3.
Microbial community linkages and species coexistence in the gut microbiome of birds. (A) Colored cooccurrence network of microbial taxa. Each node represents one OTU, and each edge represents a strong (|ρ| > 0.6) and significant correlation (FDR P < 0.01) between the two nodes. The size of each node is proportional to the degree of the OTUs; the thickness of edges is proportional to the value of the Spearman correlation coefficient. Gray edge, positive correlation (ρ > 0.6); red edge, negative correlation (ρ < −0.6). (B) Box plot of the completeness and richness of each submicrobial group (SC) in the different dietary groups. Cooccurrence percentage represents the completeness, and total abundance represents the richness.

