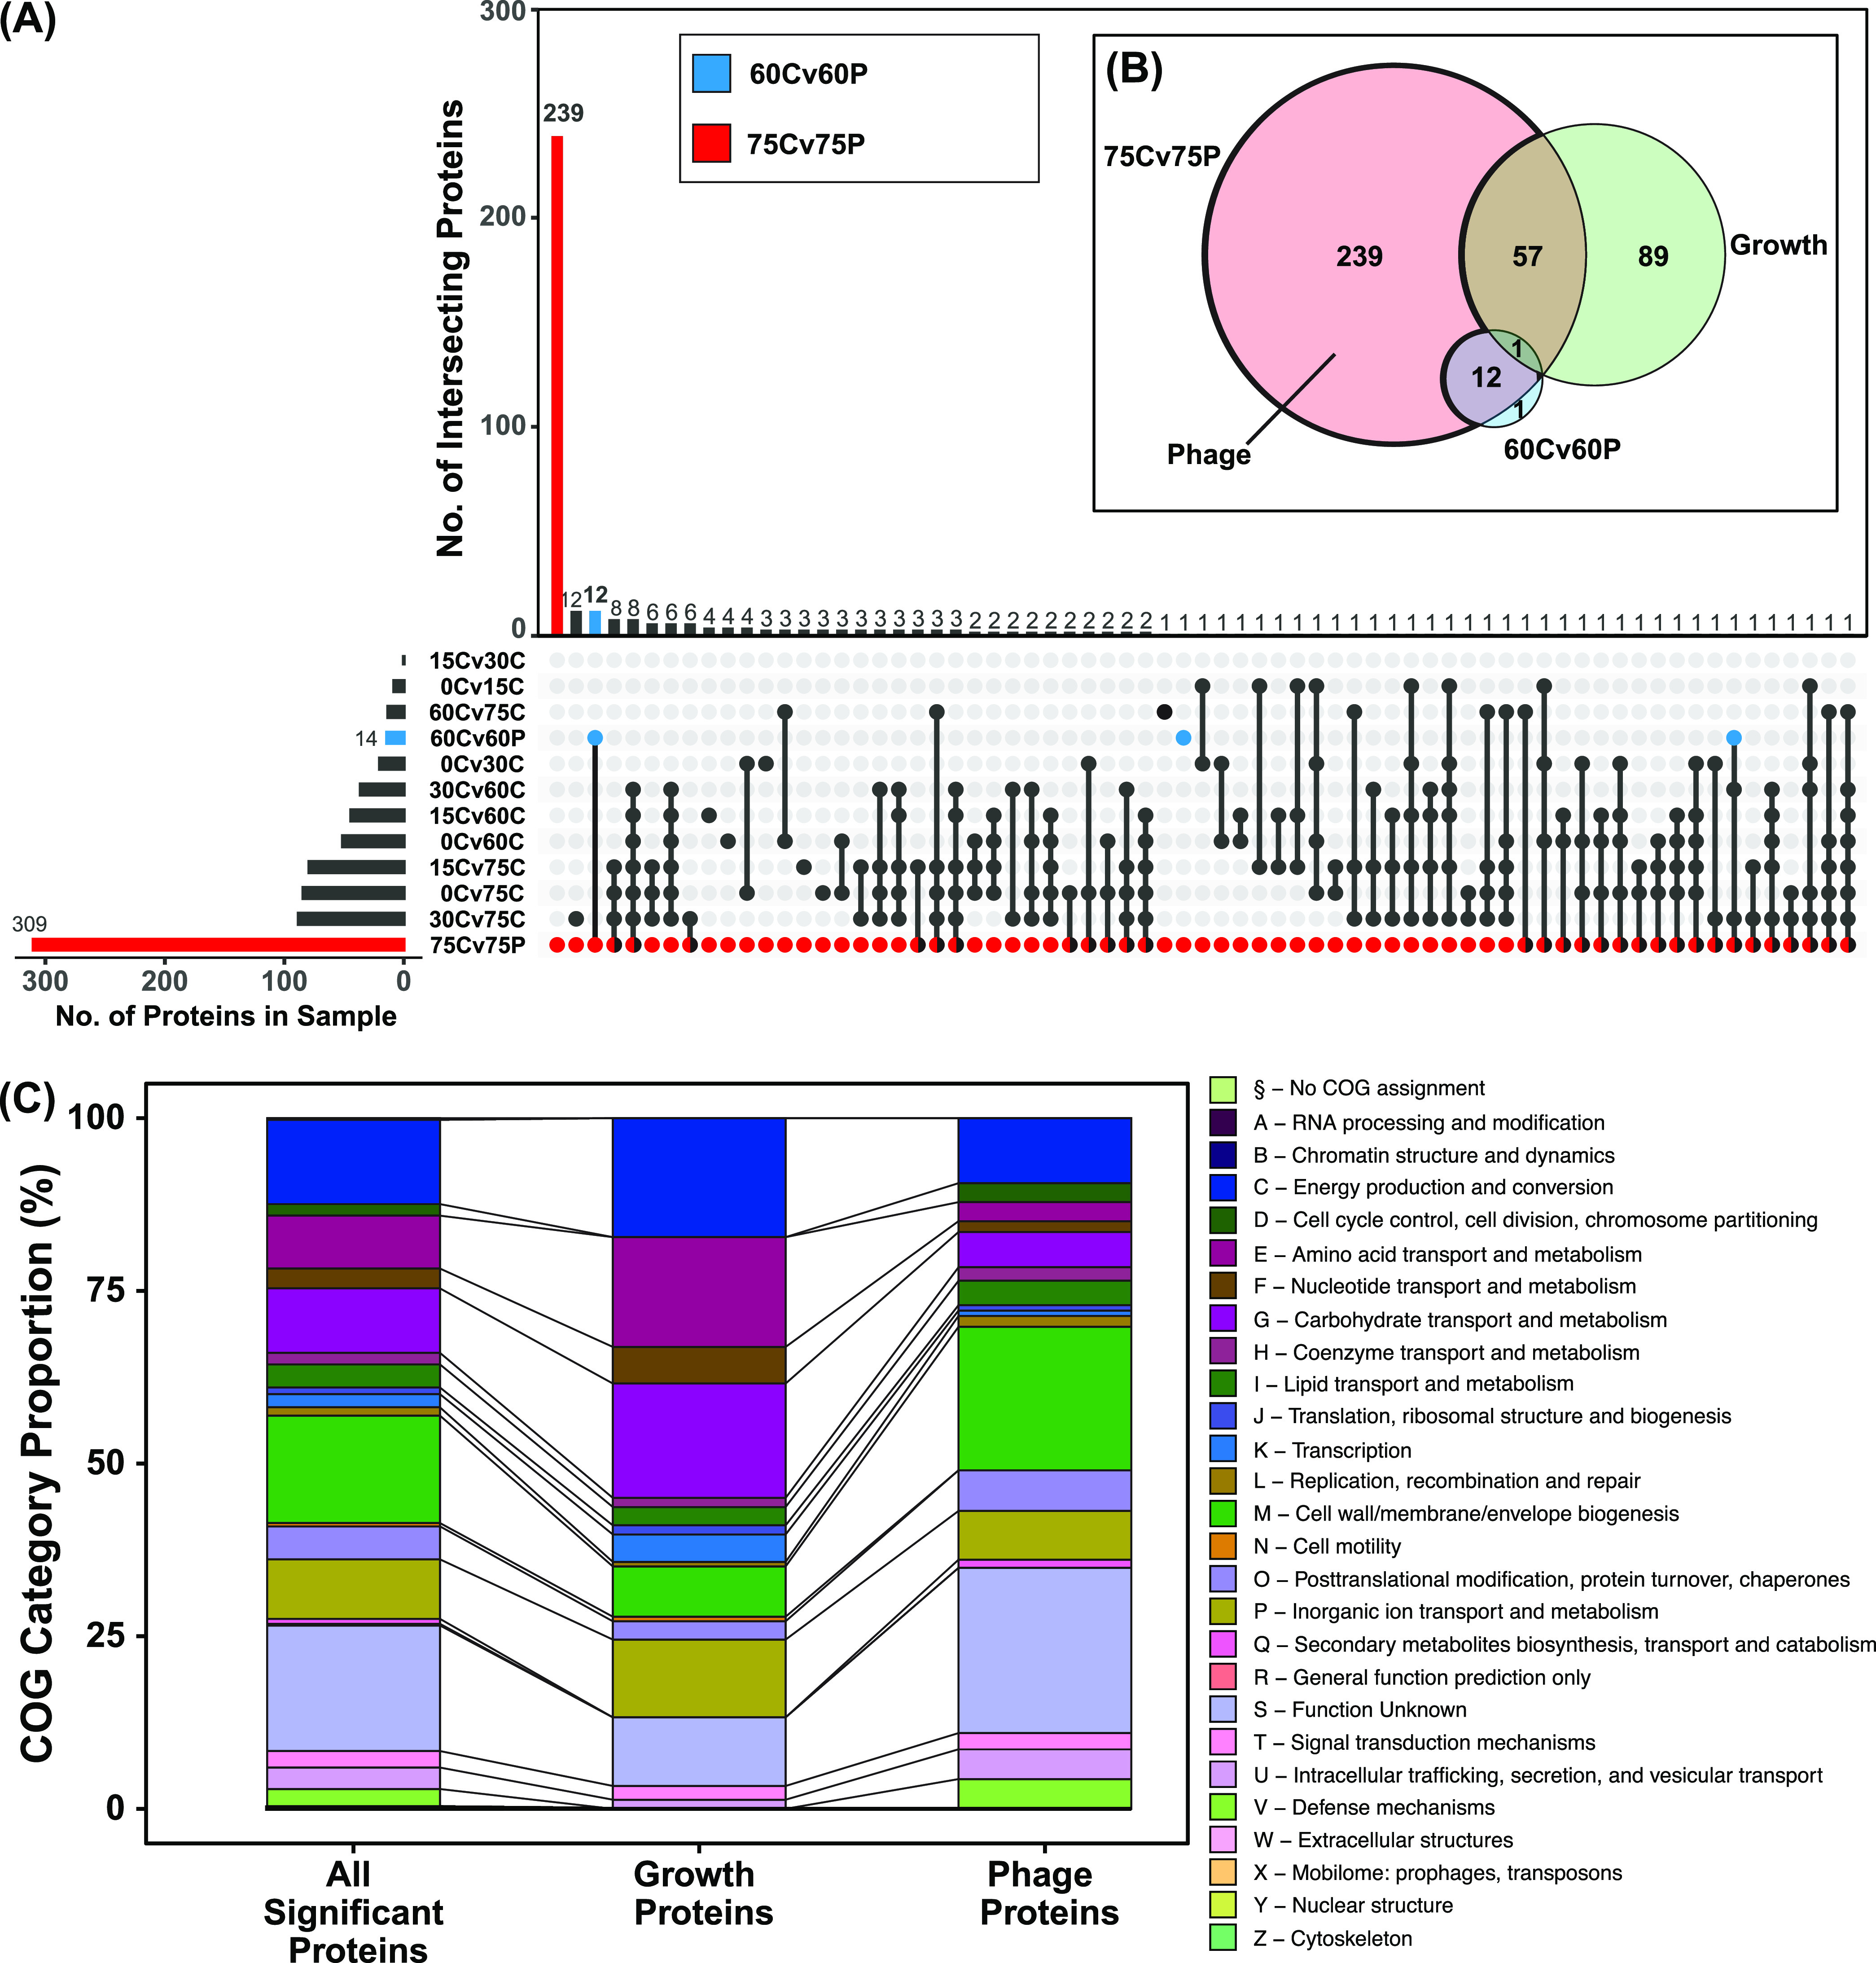
FIG 3.

Sets of significantly differentially regulated proteins due to cellular growth and φX174 infection and their functional groupings. (A) UpSet visualization of sample groups analyzed by proteomics. Each set represents the group of significantly regulated proteins (FC ±1.5, P value <0.025) extracted from comparative analyses. For example, 75Cv75P (red) is the group of significant proteins passing our stated cutoff thresholds when the 75-min mock-infected (75C) group is compared to the 75-min φX174-infected (75P) group. This plot allows visualization of redundant proteins found differentially regulated across multiple groups and, more importantly, facilitates the partitioning out of significant proteins relevant only to φX174 infection. Nonredundant sample size = 399 proteins. (B) Euler plot showing relationships between Phage, Growth, 60Cv60P, and 75Cv75P protein sets. (C) Clusters of orthologous groups (COG) categories of the Growth and Phage protein sets compared to 399 significant proteins (“All Significant Proteins”). See Data Set S1. COGs were assigned to C122 genes using the eggNOG-Mapper (24).
