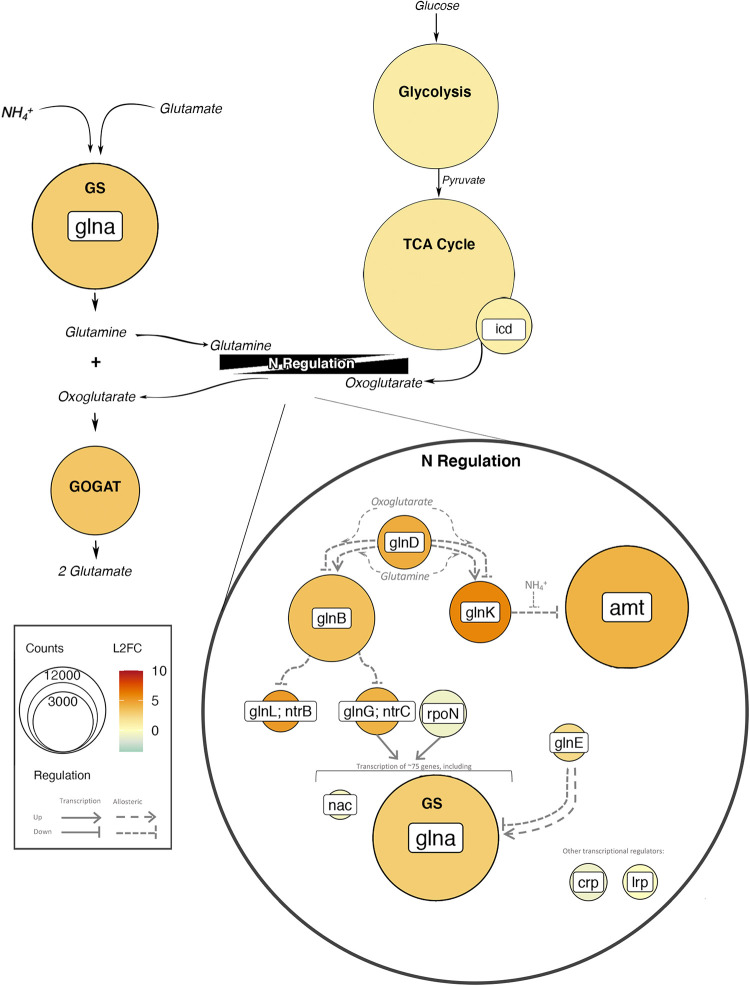
FIG 5.
Abundances and log2 fold changes of transcripts 8 h after glucose addition for C and N metabolism, including glycolysis, the TCA cycle, the N regulatory network, and GS-GOGAT. Color represents log2 fold changes of transcript abundances relative to t0, and size indicates the number of transcripts. Thin black arrows indicate reactants or products of pathways, and gray arrows represent regulatory controls. Gene names are presented in white boxes (for example, glnA), whereas pathway or enzyme names are presented in boldface type (for example, GS or glycolysis).

