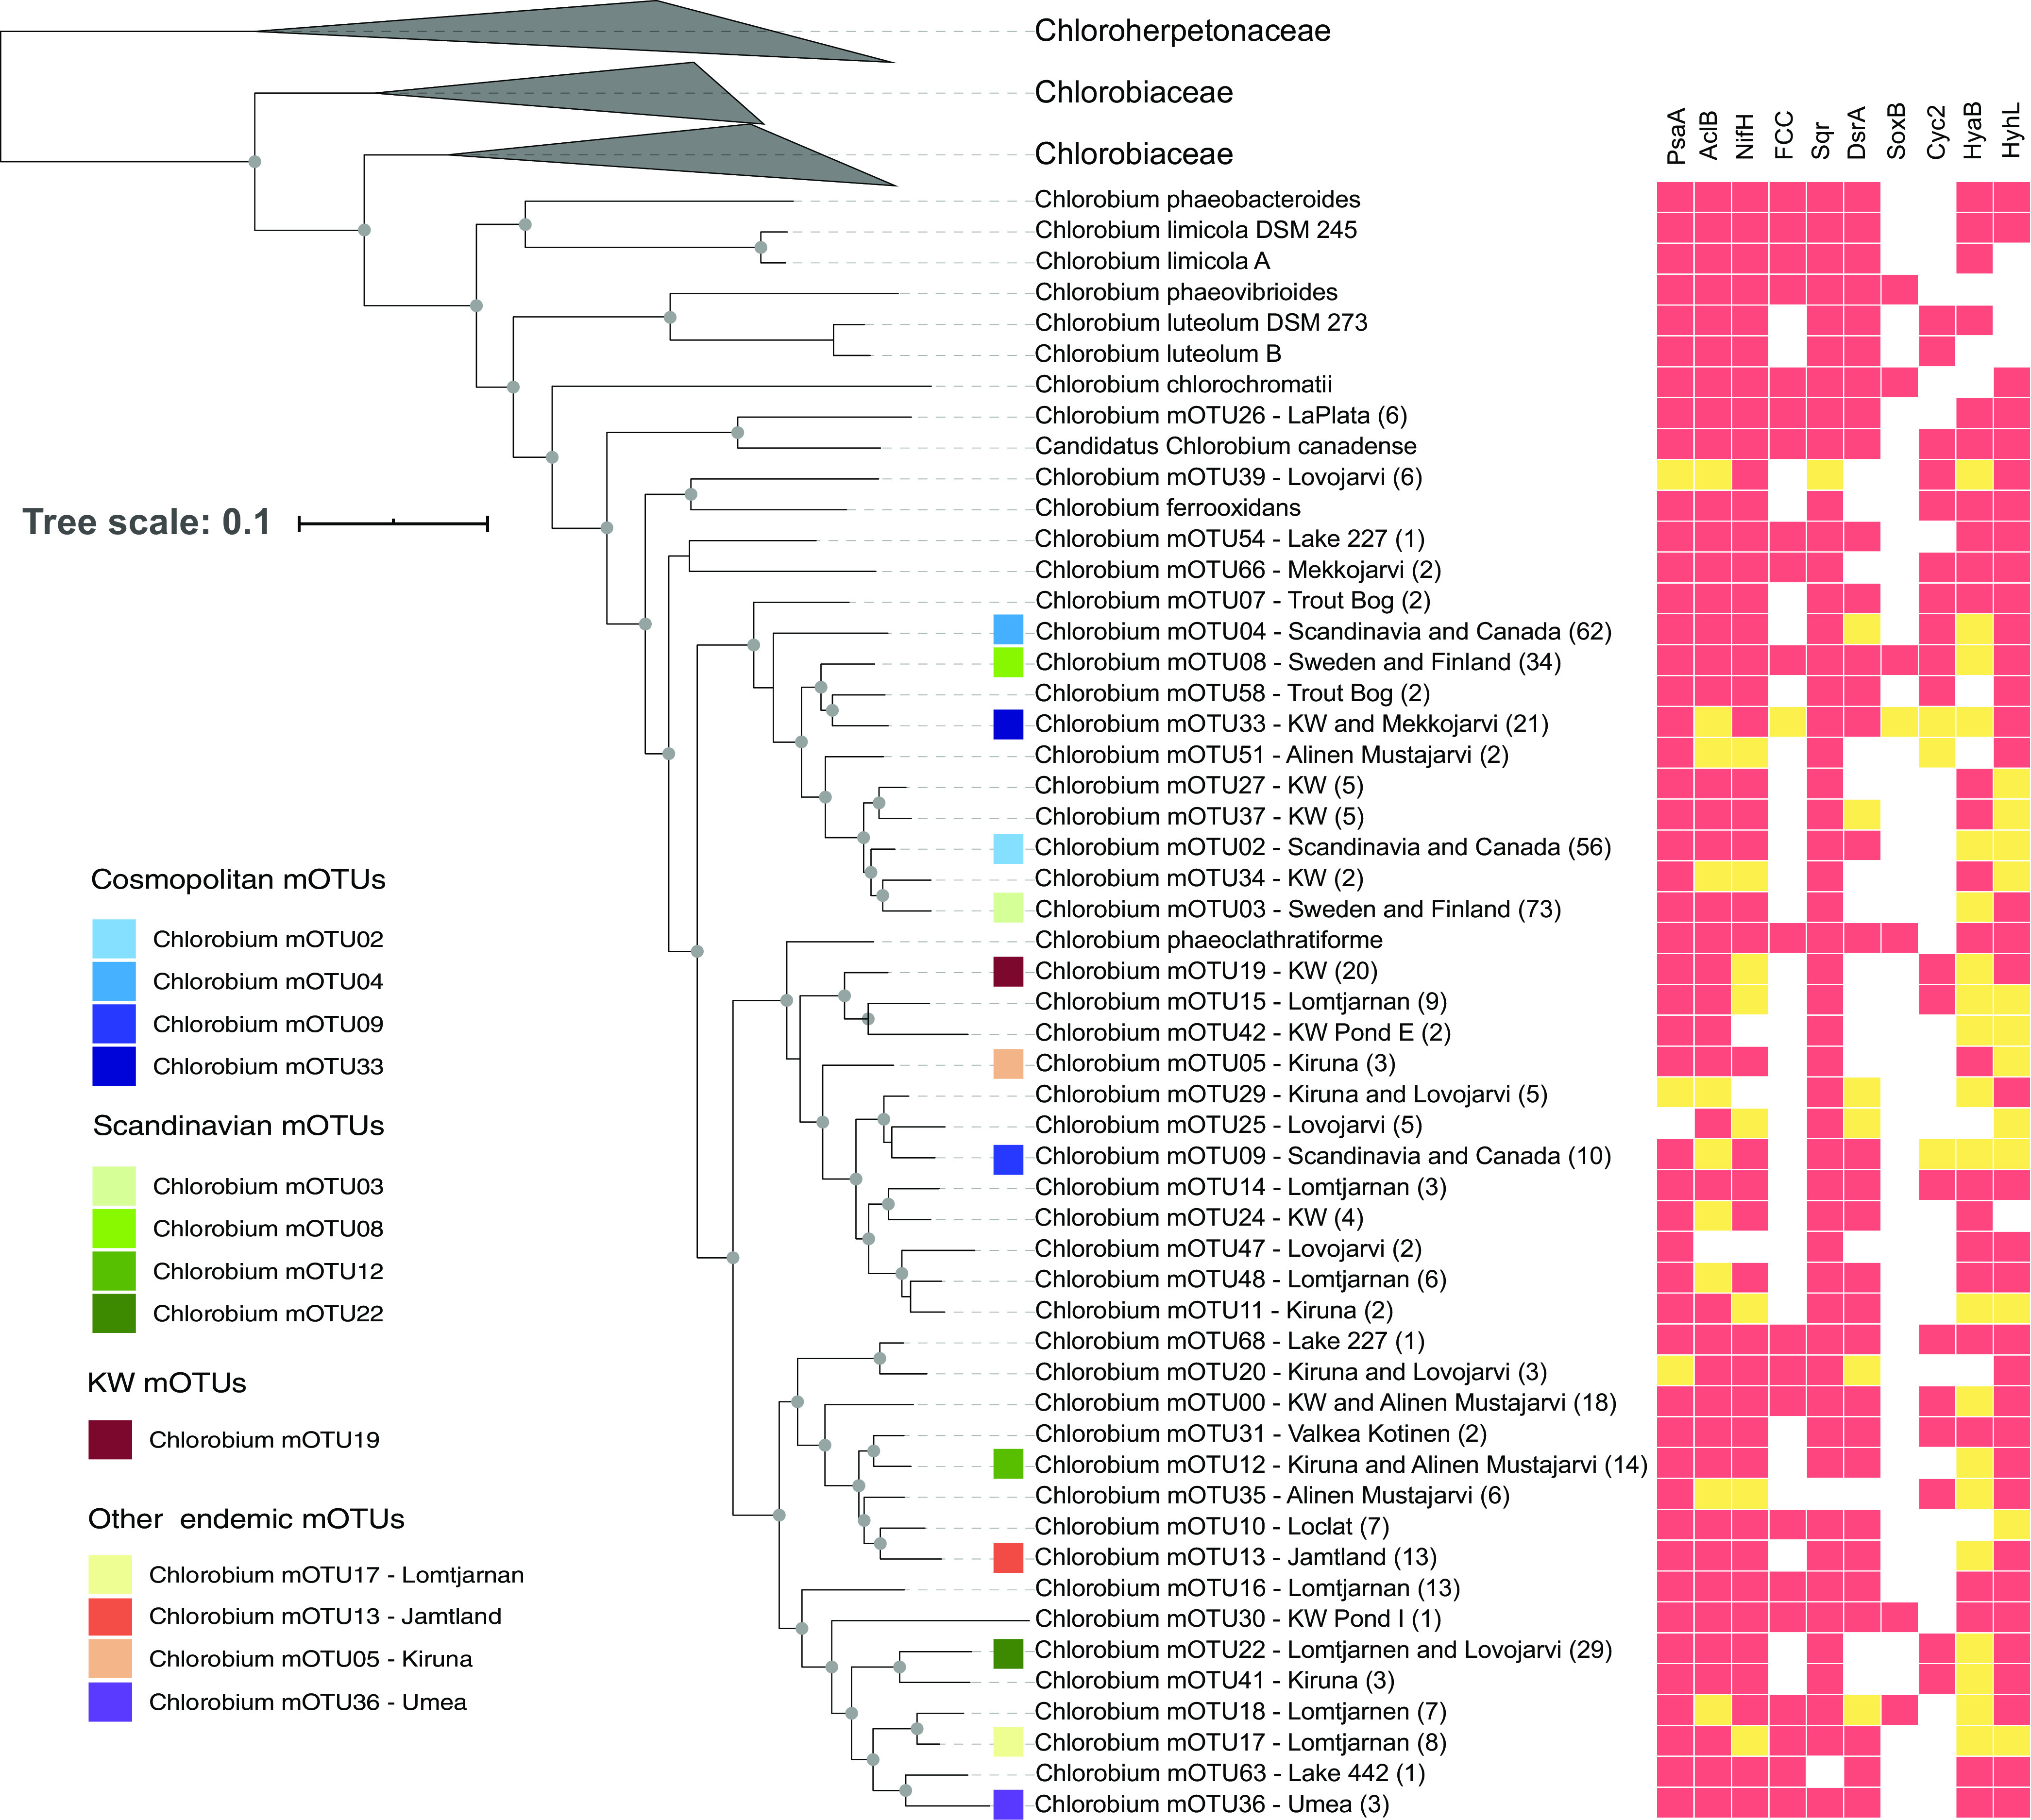
FIG 2.

Phylogenetic relationships, metabolic capabilities, and ecological distributions of Chlorobium mOTUs. The tree was constructed using GTDB-Tk “de-novo” alignment and was annotated and curated in iTOL. Isolates are shown in the tree with species names instead of mOTU numbers. Other tips on the tree show the genus name and mOTU number followed by the location from which the genomes were assembled. If the MAGs were assembled from more than one lake in the same area, then the name of the area is written. If the MAGs were assembled from more than one area in the same country, then the name of the country is written. Lake La Plata is in Bayamon, Puerto Rico; Lakes 227 and 442 are in the IISD-ELA (near Kenora, Canada). Lake Lovojarvi, Lake Mekkojarvi, Lake Valkea Kotinen, and Lake Alinen Mustajarvi are in Evo, Finland. Lake Trout Bog is in Wisconsin, Lake Loclat is in Neuchatel, Switzerland, and Lake Lomtjarnen is in Jamtland, Sweden. Numbers in parentheses show the number of genomes in each mOTU. The genus Chlorobium is part of the family Chlorobiaceae. Other genomes in different genera within the family Chlorobiaceae are clustered. The tree also includes information about the presence/absence of several genes, as indicated by their products: i.e., PsaA (photosystem I P700 chlorophyll a apoprotein A1), AcIB (ATP-citrate lyase beta-subunit), NifH (nitrogenase iron protein), FCC (flavocytochrome c sulfide dehydrogenase), Sqr (sulfide-quinone oxidoreductase), DsrA (reverse dissimilatory sulfite reductase), SoxB (thiosulfohydrolase), Cyc2 (iron-oxidizing outer membrane c-type cytochrome), HyaB (group 1d [NiFe]-hydrogenase large subunit), and HyhL (group 3b [NiFe]-hydrogenase large subunit). In the heat map, red indicates that the gene is present in the core genome of the corresponding mOTU, and yellow indicates that it is present in an accessory genome of the mOTU. White indicates that the gene is absent in the corresponding mOTU. The 13 most abundant Chlorobium mOTUs in the investigated environments have a colored square before the name of the mOTU. Gray circles represent bootstrap values higher than 50%. Please see Table S2 for information on all 71 mOTUs.
