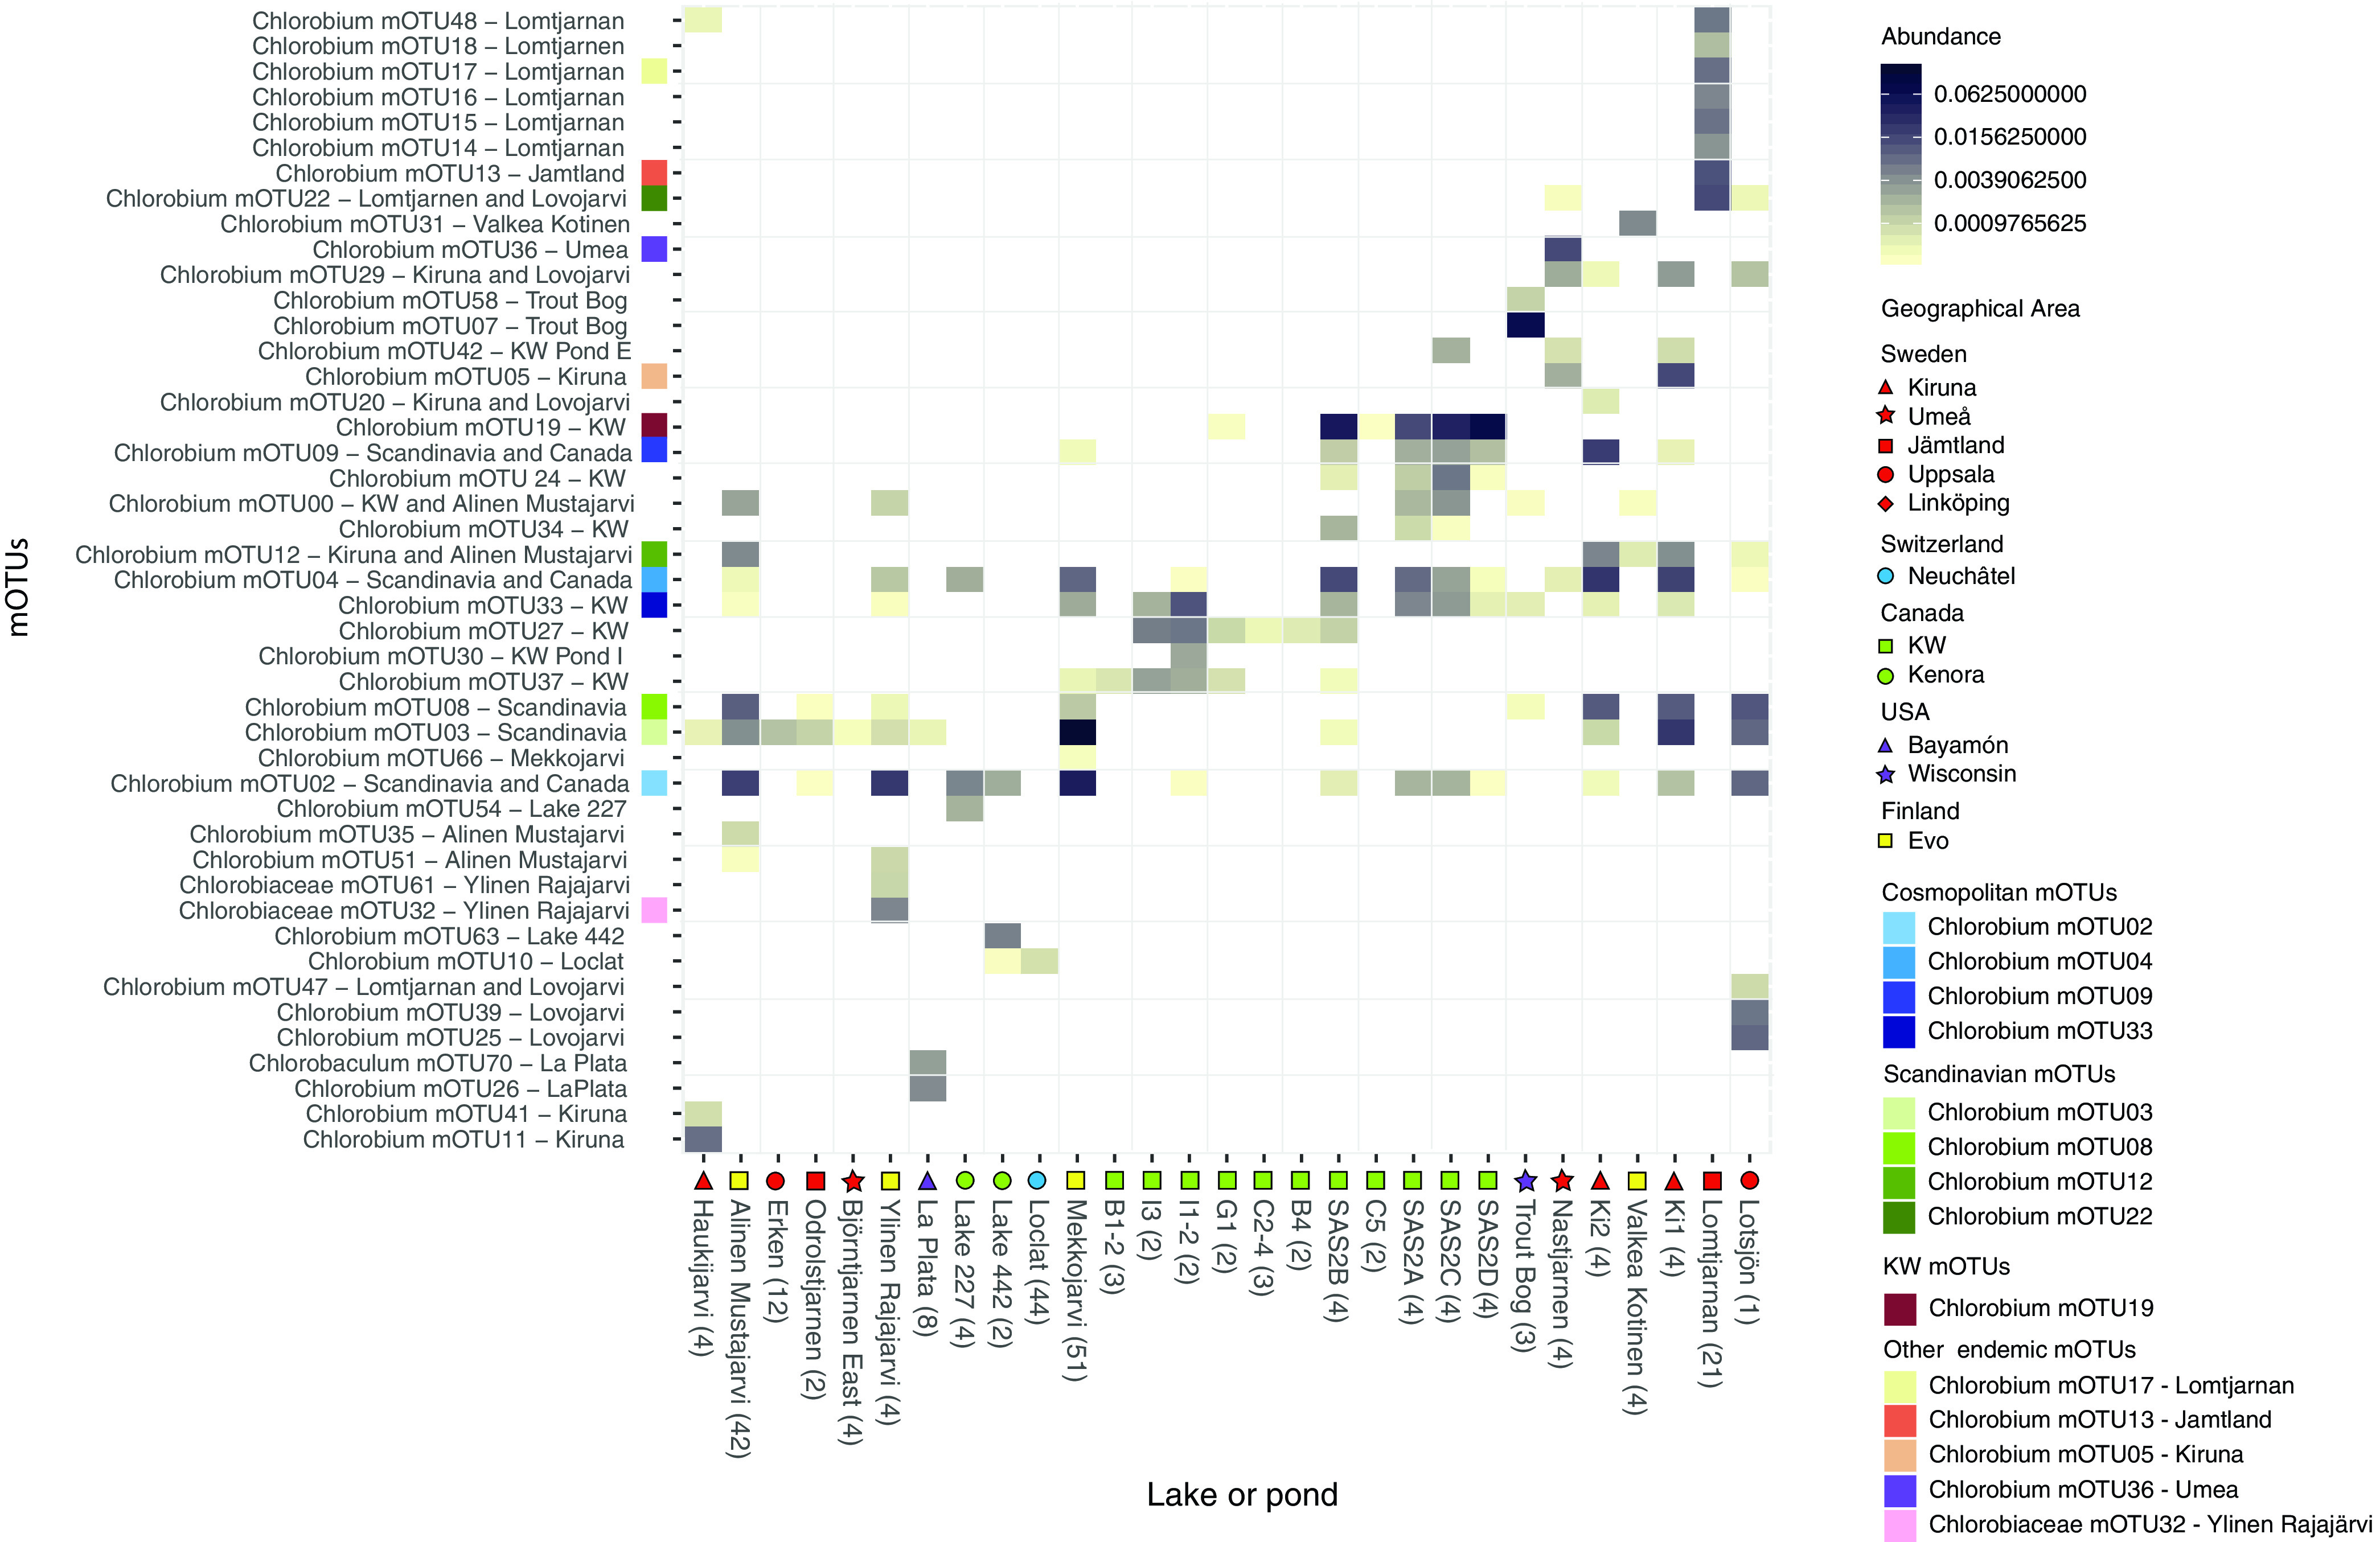
FIG 3.

Relative abundance of metagenome reads for the 45 Chlorobia mOTUs present in lake and pond metagenomes. The top 14 Chlorobia mOTUs are color coded according to the location from which they were assembled. Metagenomes were subsampled to one million reads and then mapped competitively with 100% identity cutoff to all genomes in all mOTUs. The reads were normalized to the relative abundance of reads per metagenome. Relative abundances from all depths and time points were averaged, and the number of the samples averaged is shown in the parentheses next to the lake or pond name. The cutoff for presence of an mOTU to be included was 0.03% (i.e., 0.0003 in the figure) read abundance per lake/pond. The name of the mOTUs includes geographical information about the origin of the genomes. The lakes or ponds shown along the x axis include a symbol for the region where they are located.
