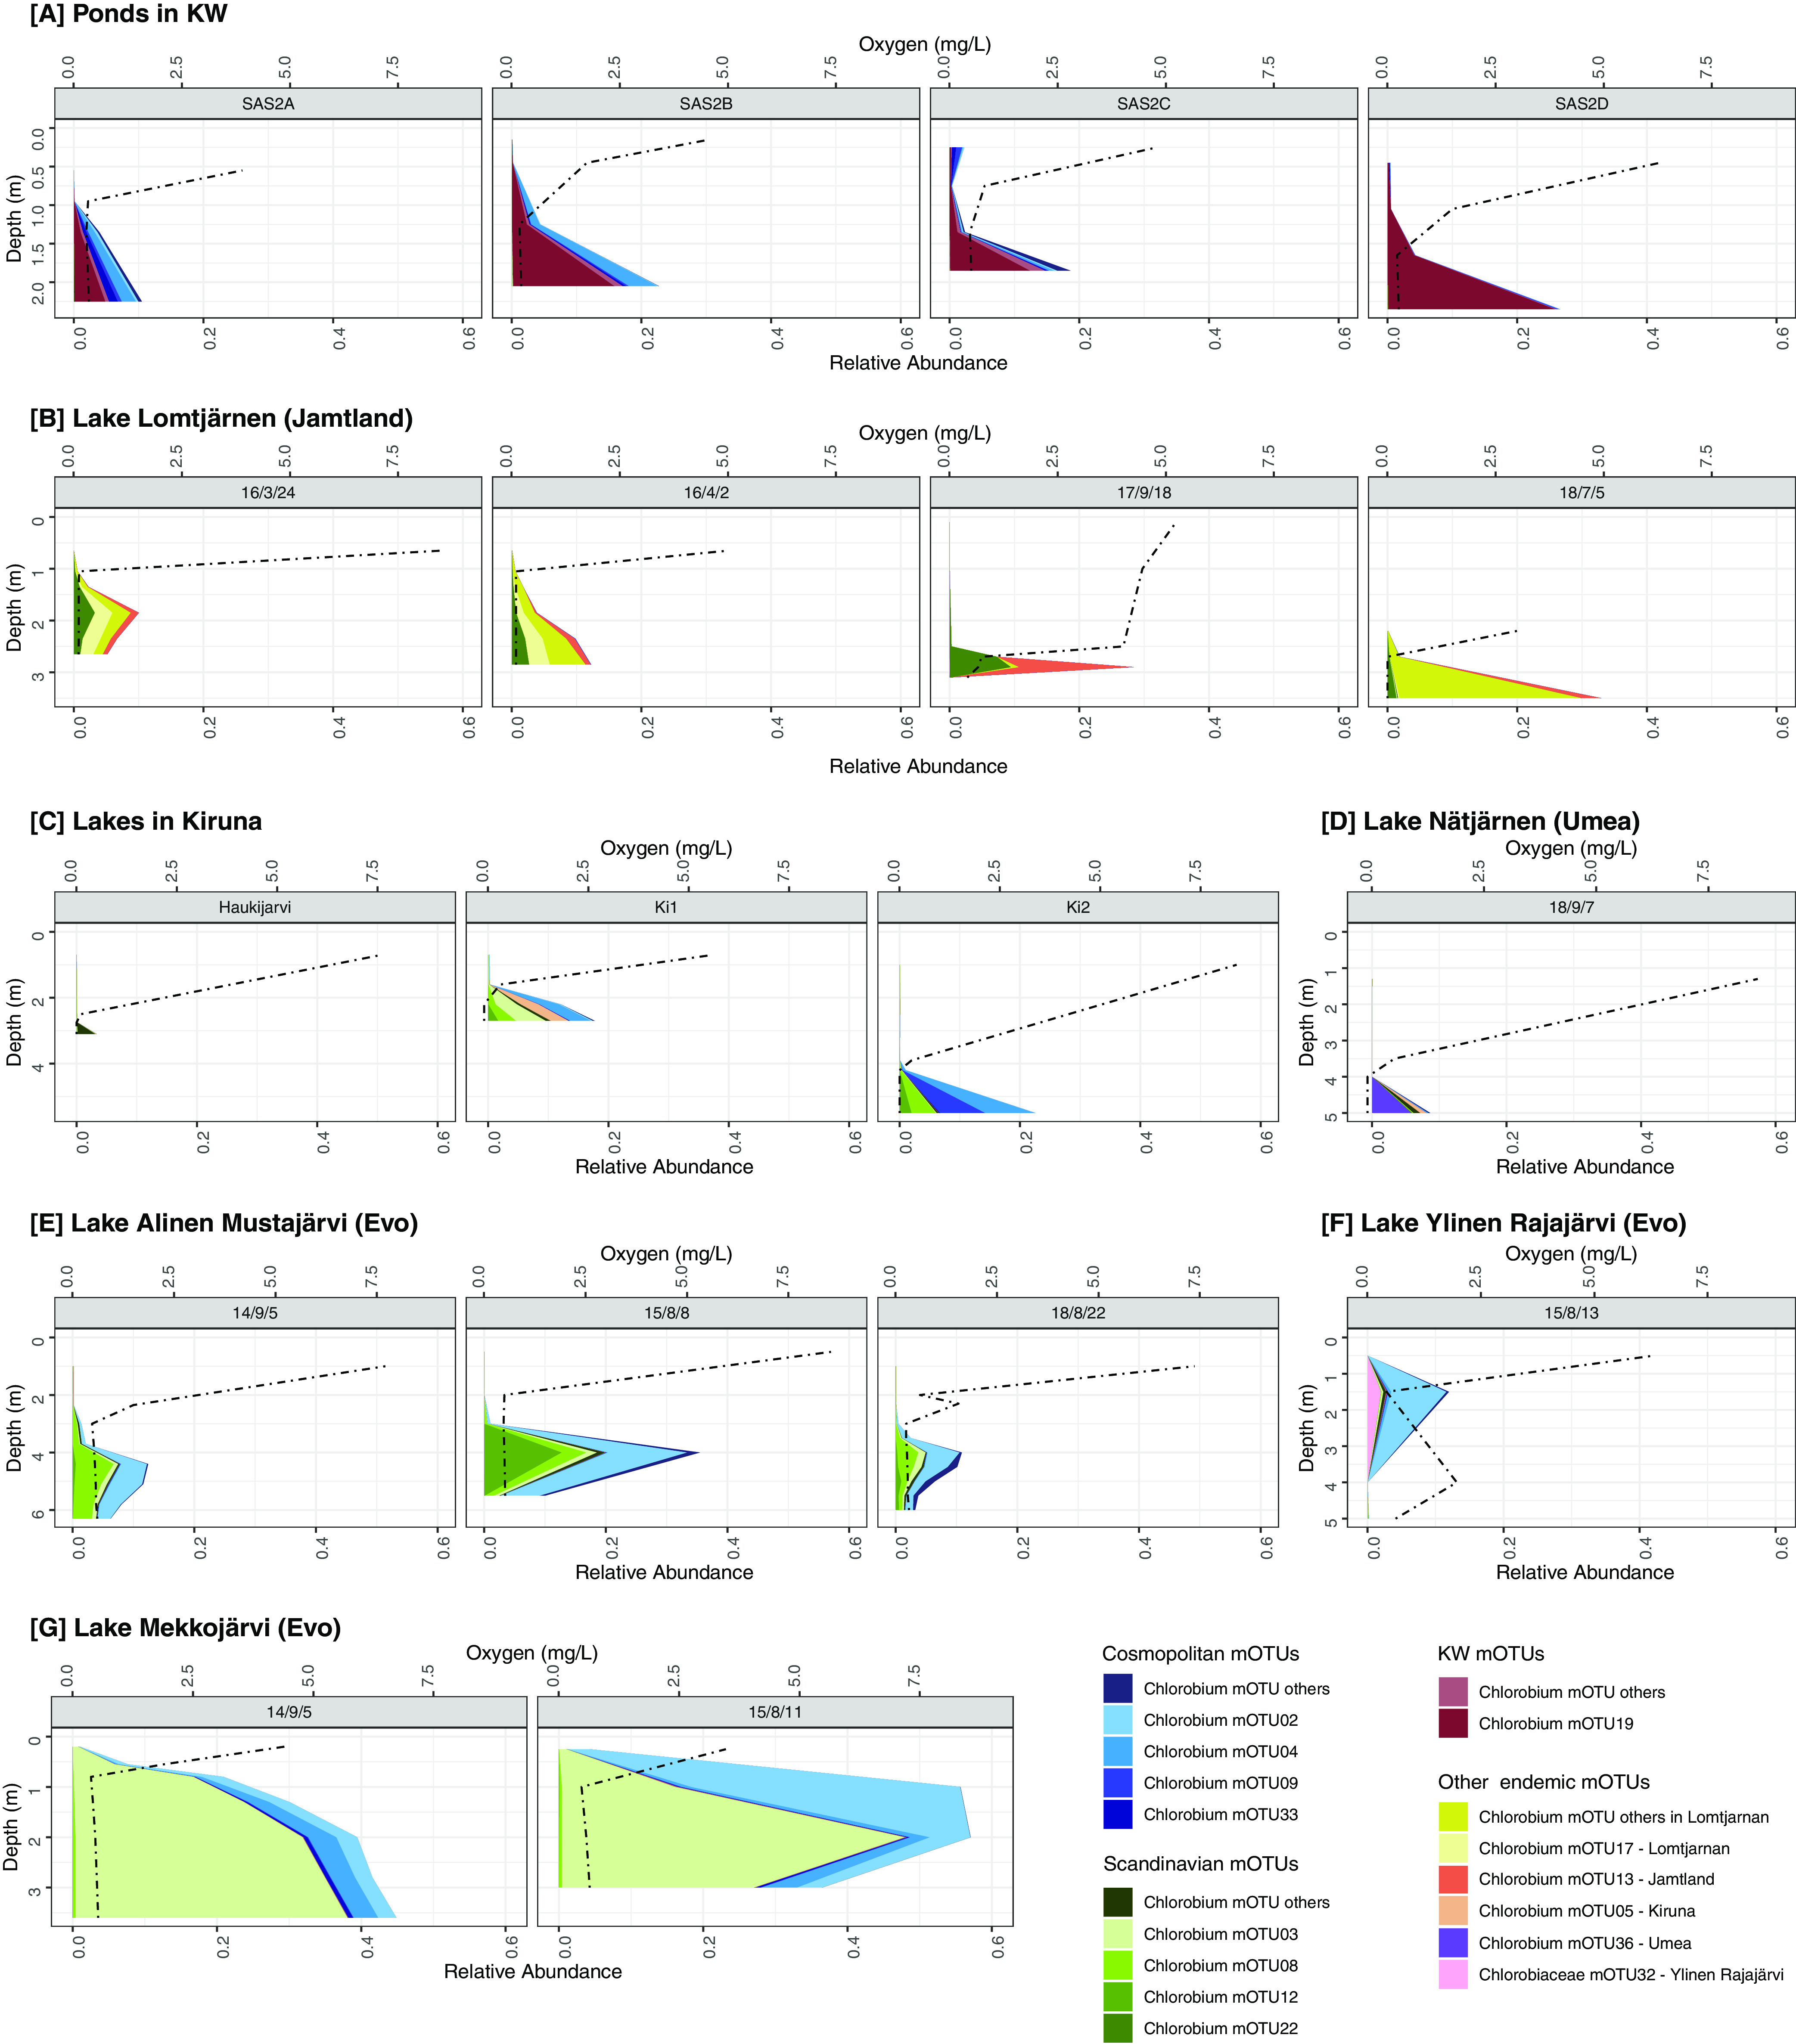
FIG 4.

Distribution of environmentally abundant mOTUs across depth profiles in the lake and pond data sets with depth-discrete sampling. Note that the 14 most abundant mOTUs have individual color coding, and the remaining abundant mOTUs are combined in several categories labeled “other.” Oxygen is represented by a dashed line. (A) Ponds in the KW area. (B) Time points for Lake Lomtjärnen in Sweden. (C) Different lakes in the Kiruna area in Sweden. (D) Lake Nästjärnen in Sweden. (E) Time points of Lake Alinen Mustajärvi in Finland. (F) Lake Ylinen Rajajärvi in Finland. (G) Time points for Lake Mekkojärvi in Finland.
