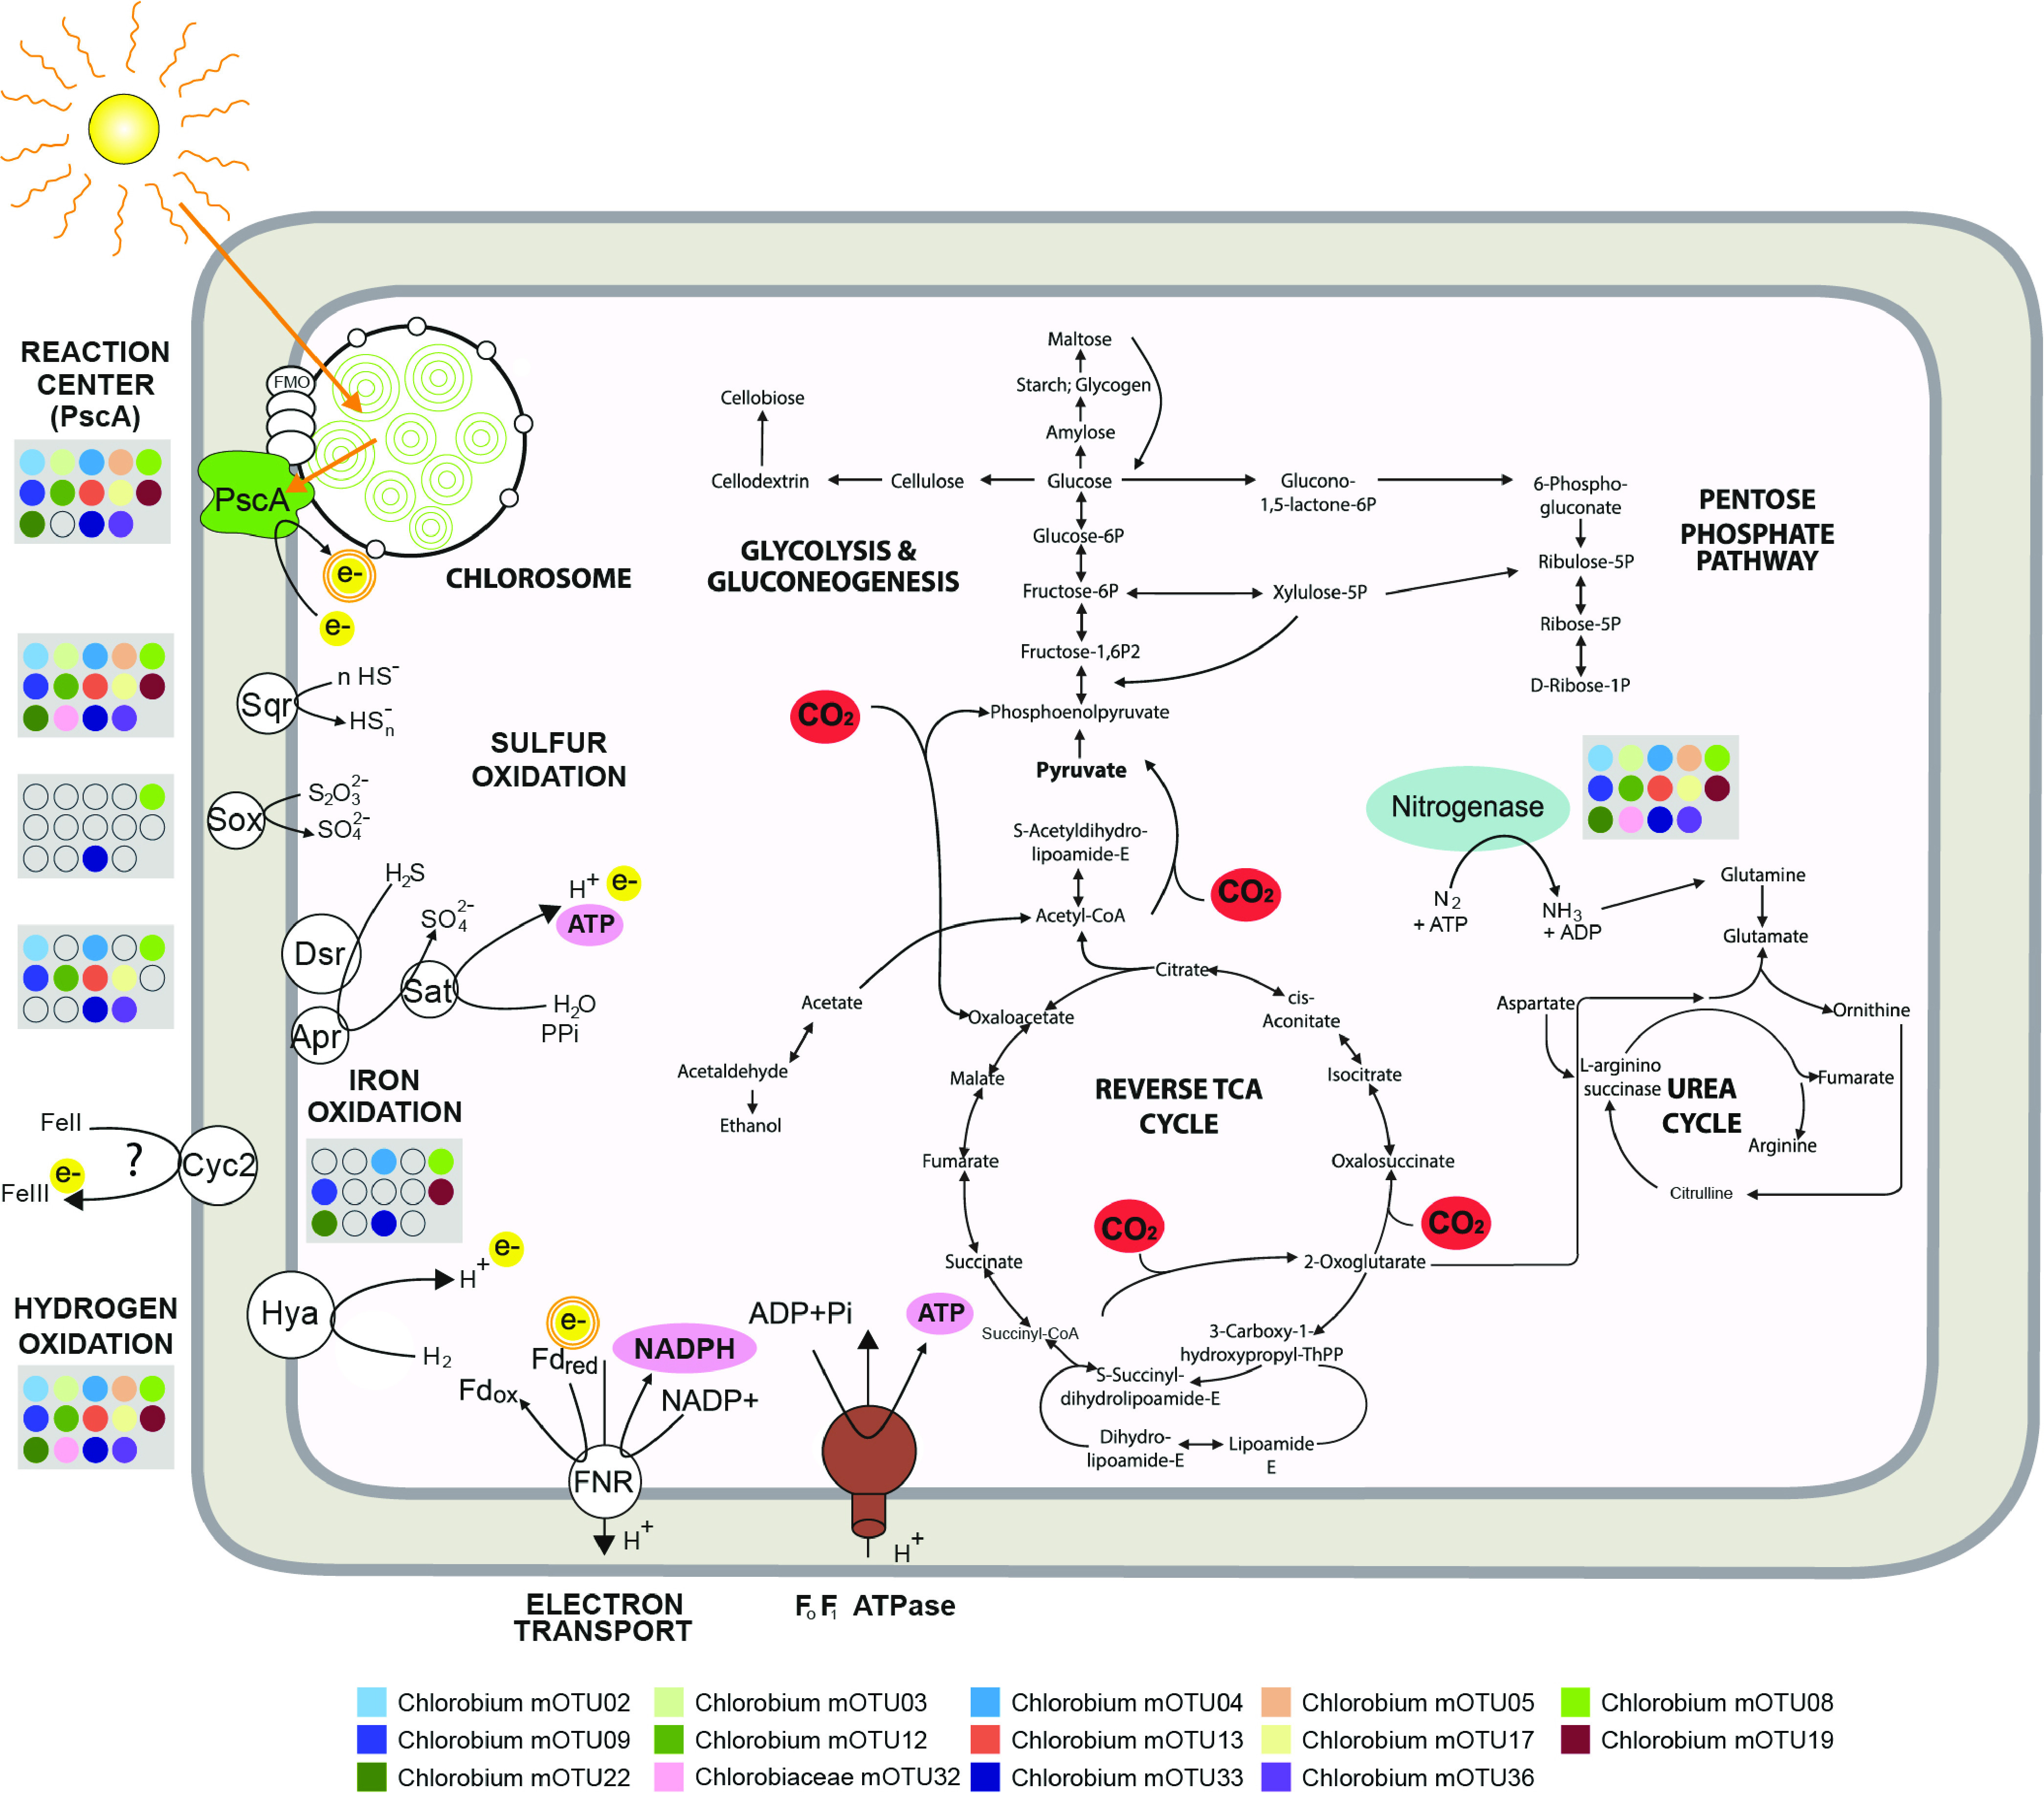
FIG 5.

Metabolic potential of the 14 most abundant Chlorobia mOTUs detected in the studied freshwater ecosystems, with a focus on photosynthesis, electron transport, and carbon fixation. Blue indicates nitrogenase, green indicates chlorosome and photochemical reaction center PscA, yellow indicates electrons being donated through oxidation reactions and photosynthesis, pink indicates reductant (NADPH) and chemical energy (ATP) produced during oxidation reactions and photosynthesis, and red indicates pathways of carbon assimilation through the reverse tricarboxylic acid cycle, as well as anaplerotic gluconeogenesis steps, using electrons derived from inorganic compound oxidation and energy derived from photosynthesis. The photosystem uses electrons derived from sulfide, hydrogen, thiosulfate, and iron oxidation and activates them using light energy, which allows proton pumping and ferredoxin reduction. Ferredoxin reduction is linked to photosystem activity, depicted with the double orange circle in electron. In the gray boxes, circles show whether marker genes are present or absent in the respective mOTUs in the legend. Genes are indicated by the following gene product abbreviations: PscA (photosystem I P700 chlorophyll a apoprotein A1), Sqr (sulfide-quinone oxidoreductase), Dsr (reverse dissimilatory sulfite reductase), Apr (adenylylsulfate reductase), Sat (sulfate adenylyltransferase), Sox (thiosulfohydrolase), Cyc2 (iron-oxidizing outer membrane c-type cytochrome), Hya (group 1d [NiFe]-hydrogenase), FNR (ferredoxin-NADP oxidoreductase), and Fd (ferredoxin).
