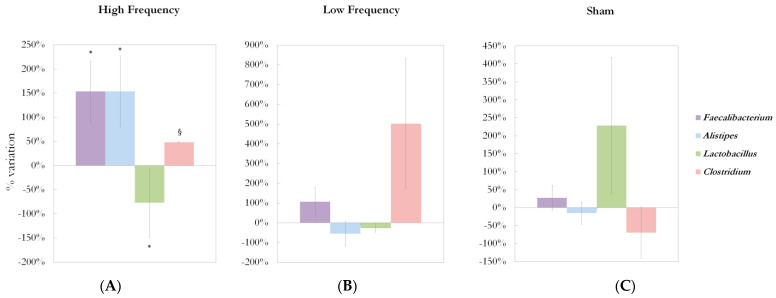
Figure 2.
Deep TMS effects on gut microbiota composition in the three treatment groups. (A) Treatment effects on Faecalibacterium, Alistipes, Lactobacillus, Clostridium genera abundances in HF group. Faecalibacterium, Alistipes, Lactobacillus, Clostridium abundance percent change from baseline to 5-week treatment are shown (mean% ± SEM). Analysis revealed a significant increase in Faecalibacterium (reads abundance: 3105.4 ± 1425.5 vs. 7897.3 ± 2314.3, +154.3%, * p = 0.013) and Alistipes (reads abundance: 1490.7 ± 656.7 vs. 3777.8 ± 1137.8, +153.4%, * p = 0.033 vs. baseline; * p = 0.039 vs. sham; * p = 0.029 vs. LF), a significant decrease in Lactobacillus (reads abundance: 260.1 ± 115.8 vs. 59.7 ± 33.1, −77.1%, * p = 0.013 vs. baseline; * p = 0.011 vs. sham), and a trend to increase in Clostridium (reads abundance: 1720.0 ± 806.8 vs. 2547.2 ± 822.1, +48.1%, § p = 0.058 vs. baseline; § p = 0.088 vs. sham) after 5 weeks of HF dTMS treatment. (B) Treatment effects on Faecalibacterium, Alistipes, Lactobacillus, Clostridium genera abundance in LF group. Faecalibacterium, Alistipes, Lactobacillus, Clostridium abundance percent variation between baseline and after the 5-week treatment is shown for low frequency (LF, 1 Hz) group. No significant variations were found in Faecalibacterium, Alistipes, Lactobacillus, Clostridium abundance in the LF group. (C) Treatment effects on Faecalibacterium, Alistipes, Lactobacillus, Clostridium genera abundance in the sham group. Faecalibacterium, Alistipes, Lactobacillus, Clostridium abundance percent variation between baseline and after the 5-week treatment is shown for the sham group. No significant variations were found in Faecalibacterium, Alistipes, Lactobacillus, Clostridium abundance in the sham group. Statistical analysis was performed using the two-tailed t-test. Legend: SEM = standard error of the mean; * p < 0.05; § 0.05 ≤ p < 0.1.

