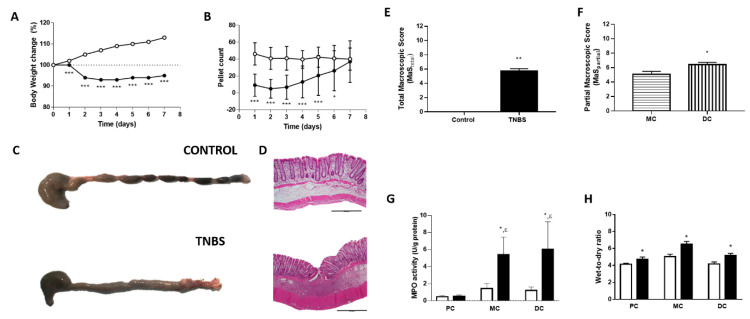
Figure 1.
(A) Body weight change of control (white circles, n = 28) and TNBS-induced rats (black circles, n = 87). (B) Number of fecal pellets of control (white circles, n = 28) and TNBS-induced rats (black circles, n = 87). (C) Macroscopic and (D) microscopic images from the colons of control and TNBS-induced animals. (E) Macroscopic score (MaS) of control (white bar, n = 28) and TNBS-induced rats (black bar, n = 87). (F) MaS of the middle colon (MC) and the correspondent distal colon (DC) of TNBS-induced rats (n = 87). (G) Myeloperoxidase (MPO) activity in the proximal colon (PC), middle colon (MC) and distal colon (DC) of control (white bars; PC: n = 12, MD: n = 9, DC: n = 9) and TNBS-induced rats (black bars; PC: n = 16, MD: n = 11, DC: n = 8). (H) Wet-to-dry ratio in the proximal colon (PC), middle colon (MC) and distal colon (DC) of control (white bars; PC: n = 29, MC: n = 21, DC: n = 21) and TNBS-induced rats (black bars; PC: n = 20, MC: n = 17, DC: n = 19). * p < 0.05 vs. corresponding controls (except in (D), where * p < 0.05 vs. MC), ** p < 0.0001, *** p < 0.000001 vs. control animals and ε p < 0.05 vs. TNBS-PC.

