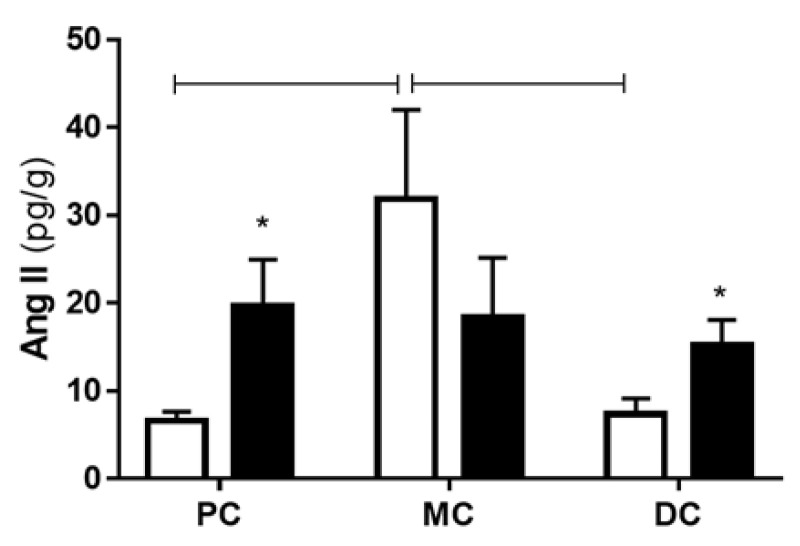
Figure 3.
Levels of Ang II of control (white bars) and TNBS-induced rats (black bars) in the PC (controls: n = 5; TNBS: n = 4), the MC (controls: n = 5; TNBS: n = 5) and the DC (controls: n = 6; TNBS: n = 5). * p < 0.05 vs. corresponding control; capped lines point to statistically significant differences between groups with p < 0.05.

