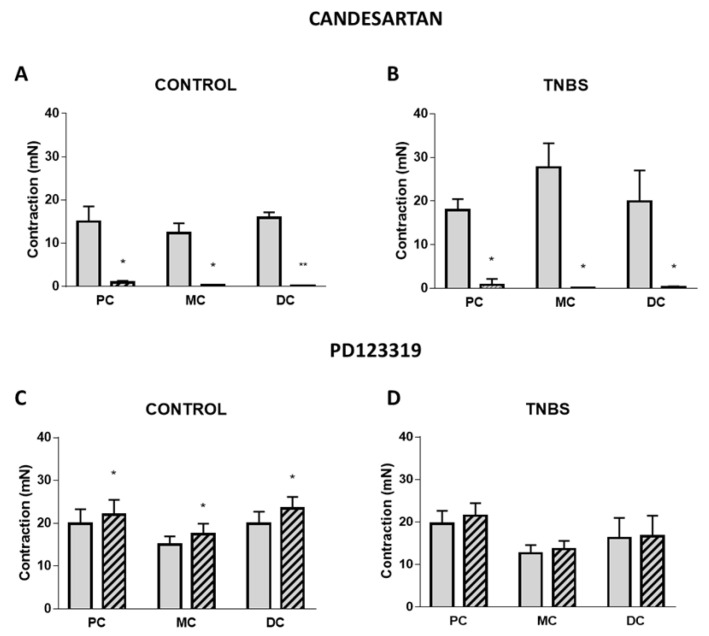
Figure 4.
Characterization of the receptors involved in the contraction induced by Ang II in PC, MC and DC. Gray bars and striped bars represent, respectively, the absence and presence of Candesartan 10 nM in (A) control (PC: n = 6; MC: n = 6; DC: n = 6) and (B) TNBS-induced animals (PC: n = 6; MC: n = 7; DC: n = 7) and the absence and presence of PD123319 100 nM in (C) control (PC: n = 7; MC: n = 6; DC: n = 7) and (D) TNBS-induced animals (PC: n = 11; MC: n = 9; DC: n = 8). * p < 0.05 and ** p < 0.0001 vs. Ang II alone.

