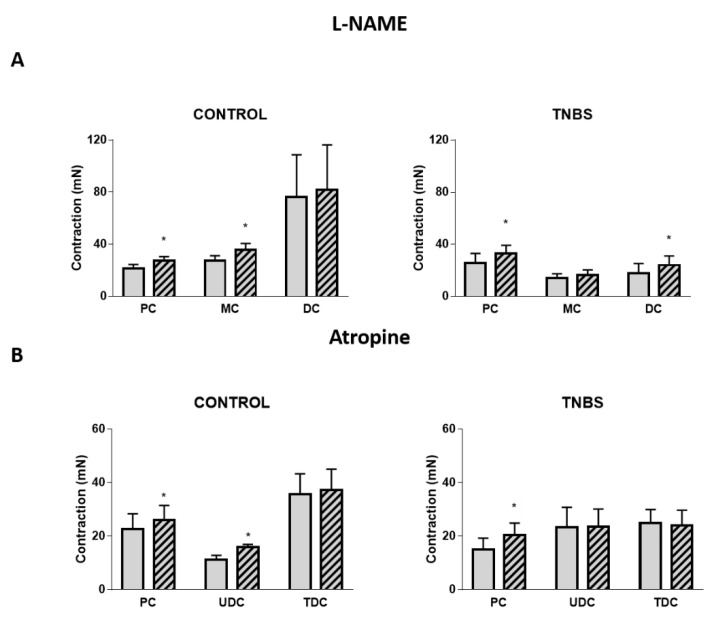
Figure 7.
Contractile response to Ang II in the PC, MC and DC in the absence (gray bars) and presence (striped bars) of (A) L-NAME 100 µM in control (PC: n = 5; MC: n = 6; DC: n = 6) and TNBS-induced animals (PC: n = 6; MC: n = 5; DC: n = 6); and (B) atropine 1 µM in control (PC: n = 5; MC: n = 6; DC: n = 6) and TNBS-induced animals (PC: n = 6; MC: n = 5; DC: n = 5). * p < 0.05 vs. Ang II alone.

