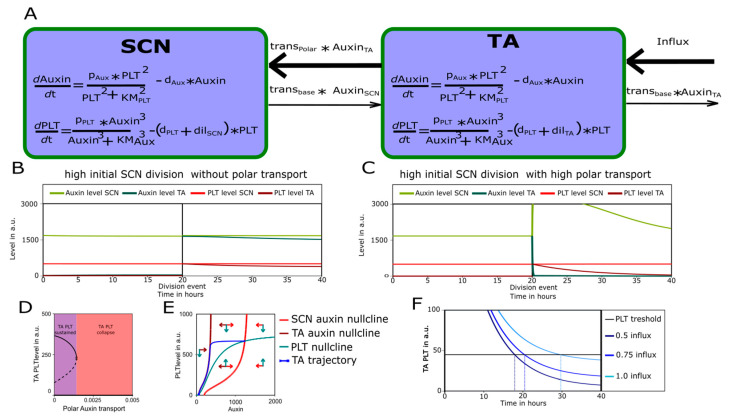
Figure 4.
(A) Schematic representation of Two-compartment model with an Stem Cell Niche (SCN) and a transit-amplifying (TA) compartment. (B,C) Simulated SCN division after 20 h replacing the TA compartment in a Two-compartment model with low (B) or high (C) polar transport. (D) Bifurcation diagram of TA compartment PLT levels for various polar auxin transport levels. Continuous lines show stable steady state and dashed line shows instable steady state. Purple indicates polar auxin transport values for which the TA compartment can maintain a high PLT state (as in B). Red indicates polar auxin transport values for which the TA cannot maintain a high PLT state (as in C). (E) Phase plane with nullclines for the single-compartment model with two auxin nullclines. The PLT nullcline and trajectories are shown in green, the SCN auxin nullcline and trajectories are shown in red, and the TA auxin nullcline and trajectories, where the effect of polar auxin transport is modelled as an additional loss of auxin, are shown in dark red. (F) Post division TA compartment PLT dynamics for various shoot auxin influx levels (in dark to light blue). The horizontal line shows the PLT threshold that is reached at different timepoints after that TA cell has left the SCN (dashed lines).

