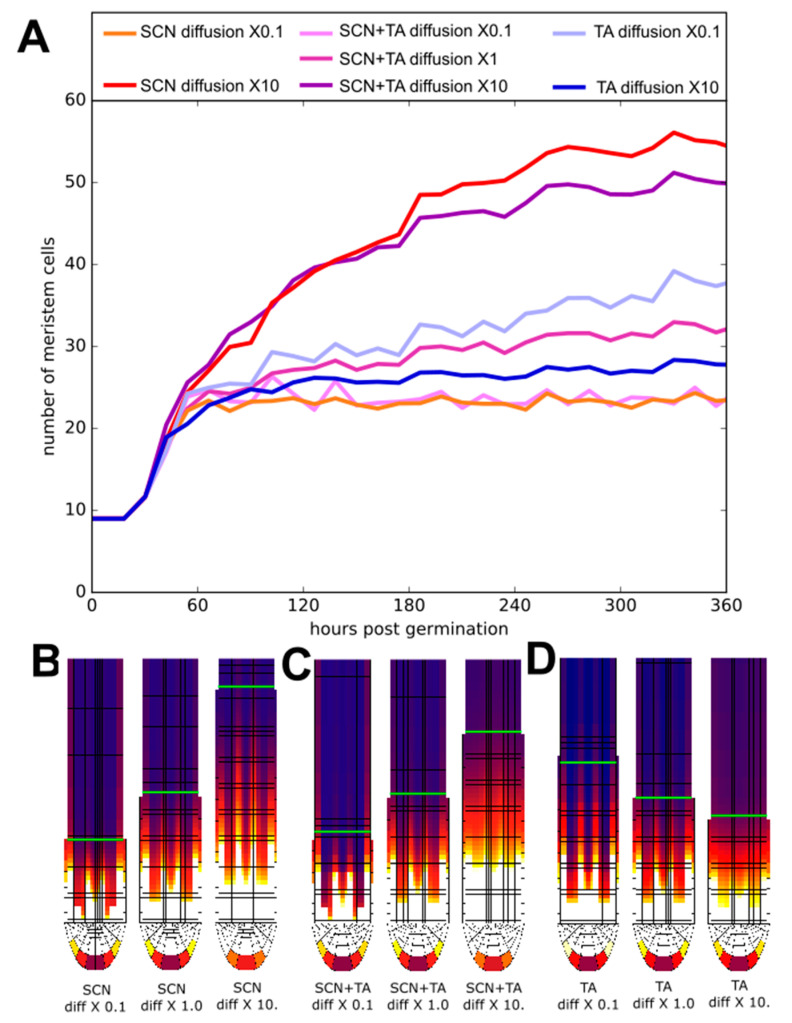
Figure 6.
(A) Meristem size trajectories for various tissue-specific alterations of the diffusion rate. Red lines: changes in longitudinal and transversal SCN diffusion rate with a factor 10 (dark red) or 0.1 (lightred). Blue lines: changes in longitudinal TA diffusion rate with a factor10 (dark blue) or 0.1 (lightblue). Changes in both SCN and TA diffusion rate with a factor10 (purple); or 0.1 (lightpink). Dark pink: default diffusion rates. B-D) Steady-state PLT protein patterns for different SCN (B), SCN and TA (C) and TA (D) diffusion rates shown in A. Green line demarcates the end of the meristem zone.

