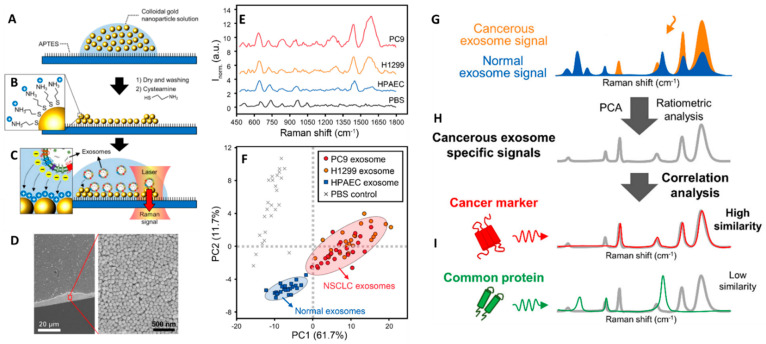
Figure 4.
(A–C) Outline of the substrate fabrication and experimental set-up. (D) Scanning electron microscopy (SEM) image at an edge of the substrate. (E) SERS spectra of exosomes derived from HPAEC (normal) and H1299, PC9 (lung cancer) cell lines. Phosphate-buffered saline (PBS) was chosen as the experimental control. (F) PCA score plot of the SERS data and 90% confidence ellipses. (G–I) Schematic representation of the experimental process for the identification of unique SERS profile of lung cancer cell-derived exosomes followed by comparison to the profiles of their potential surface protein markers to determine their respective similarity. Adapted with permission from [80]. Copyright 2018, American Chemical Society.

