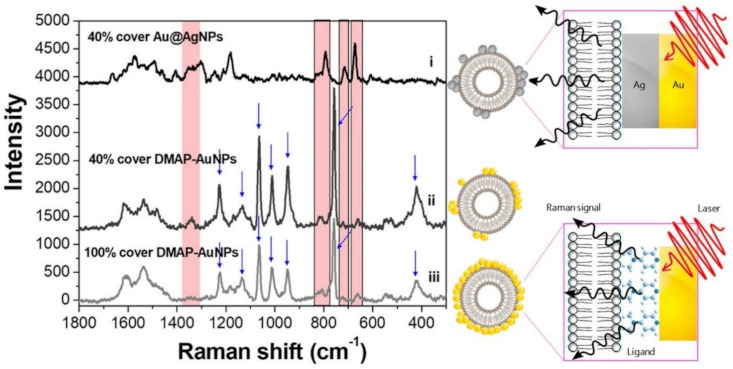
Figure 5.

SERS spectra of B16F10 melanoma derived exosomes for 40% coverage with Au@AgNPs or DMAP–AuNPs, and 100% coverage with DMAP–AuNPs. Intense DMAP bands are indicated by blue arrows (these features disappear upon silver coating). An illustrative description of DMAP–AuNPs or Au@AgNPs attached on the exosomes surfaces is also included. Adapted with permission from [88]. Copyright 2019, American Chemical Society.
