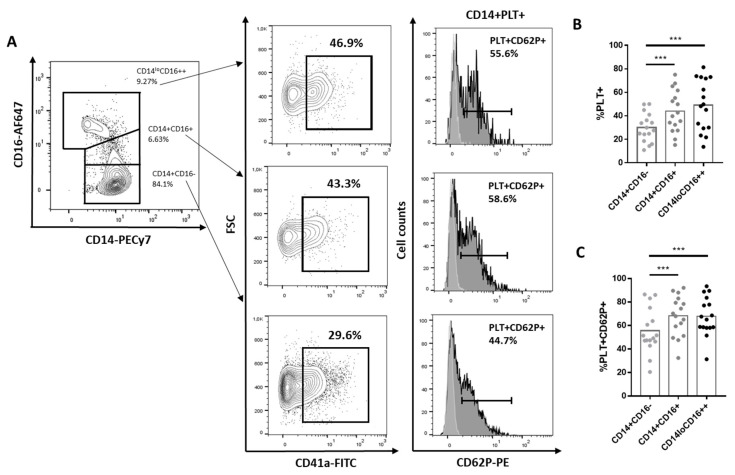
Figure 1.
Percentage of CD14+CD16-, CD14+CD16+ and CD14+CD16++ with bound platelets. (A) A representative experiment showing the gating strategy for identifying monocyte subsets CD14+CD16-, CD14+CD16+ and CD14+ CD16++. CD14+ with bound PLTs (CD14+CD41a+) and monocytes with activated bound platelets (CD14+CD41a+CD62P+) (dark histograms). Light grey histograms represent CD62P expression on each subpopulation of monocytes without PLTs. (B). Percentage of CD14+PLT+ in each monocyte subset from 16 independent experiments (C). Percentage of monocytes with activated bound platelets (PLT+CD62P+) in each CD14+PLT+ monocyte subset from 16 independent experiments. Statistical analysis was performed using one-way ANOVA with Tukey’s multiple comparisons test. *** p < 0.001.

