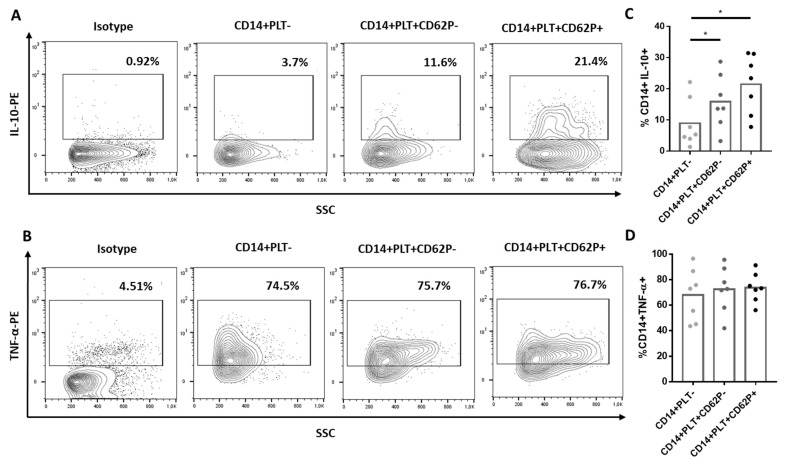
Figure 3.
Cytokine production by monocytes without platelets (CD14+PLT-) and with non-activated (CD14+PLT+CD62P-) or activated (CD14+PLT+CD62P+) bound platelets. PBMCs were stimulated with LPS for 4 hours, and the secretion of IL-10 and TNF-α was analyzed by flow cytometry. A representative experiment is shown here (n = 7). The percentage of (A) IL-10+ or (B) TNF-α+ cells on CD14+PLT-, CD14+PLT+CD62P- or CD14+PLT+CD62P+ is shown. A comparison between percentages of (C) IL-10+ or (D) TNF-α+ cells on CD14+PLT-, CD14+PLT+CD62P- and CD14+PLT+CD62P+ is shown from 7 independent experiments. Statistical analysis was performed using one-way ANOVA with Tukey’s multiple comparisons test. * p < 0.05.

