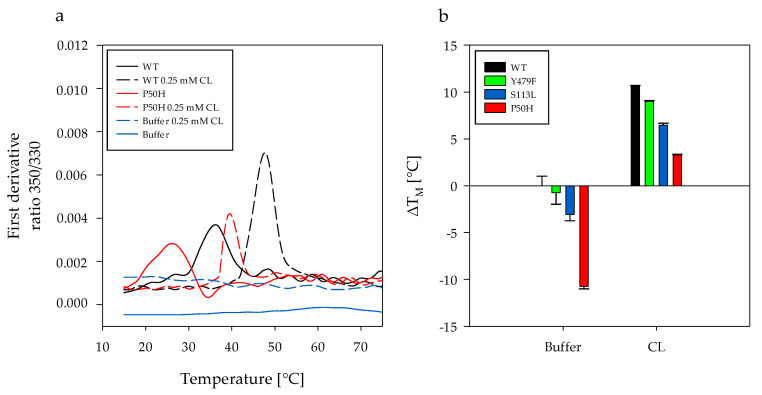
Figure 4.
The effect of amino acid exchange and the addition of 0.25 mM CL on the stability of CPT II (1 mg/mL) assessed by nanoDSF. (a) The first derivatives of the transition curves resulting from the ratio 350/330 nm were plotted against the temperature. The TM values are derived from the maxima of the obtained curves. The black and red solid lines show the curves of WT and variant P50H measured in assay buffer. The black and red dashed lines show the results of WT and variant P50H measured in assay buffer with 0.25 mM CL. (b) The TM of WT (37 °C) in buffer was used as reference value (ΔTM = 0 °C) to determine the ΔTM for the variants and the ΔTM for WT and variants after the addition of 0.25 mM CL. Error bars are SD derived from three independent experiments. The significant differences of ∆TM of WT and the variants between the different buffer composition as well as the statistical differences of TM between WT and the variants are indicated as p-values in Tables S5–S7.

