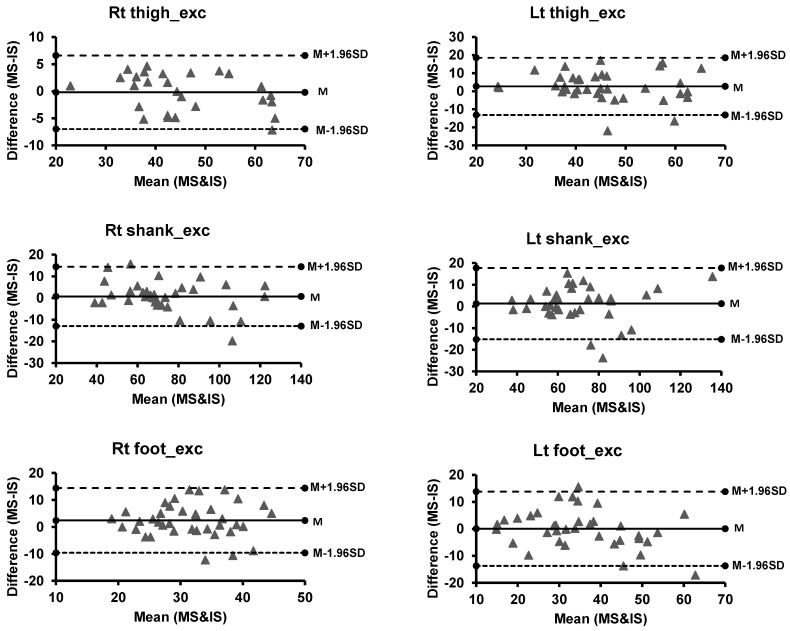
Figure 2.
Bland-Altman plots of segment mobility measures (Dance test) for motion (MS) and inertial sensor (IS) systems. The solid line represents the mean (M), while the two dash lines above and below M represent the upper (M + 1.96 SD) and lower (M − 1.96 SD) limits of agreements (1.96 standard deviations), respectively. Abbreviation: Lt = Left, Rt = Right, exc = excursion.

