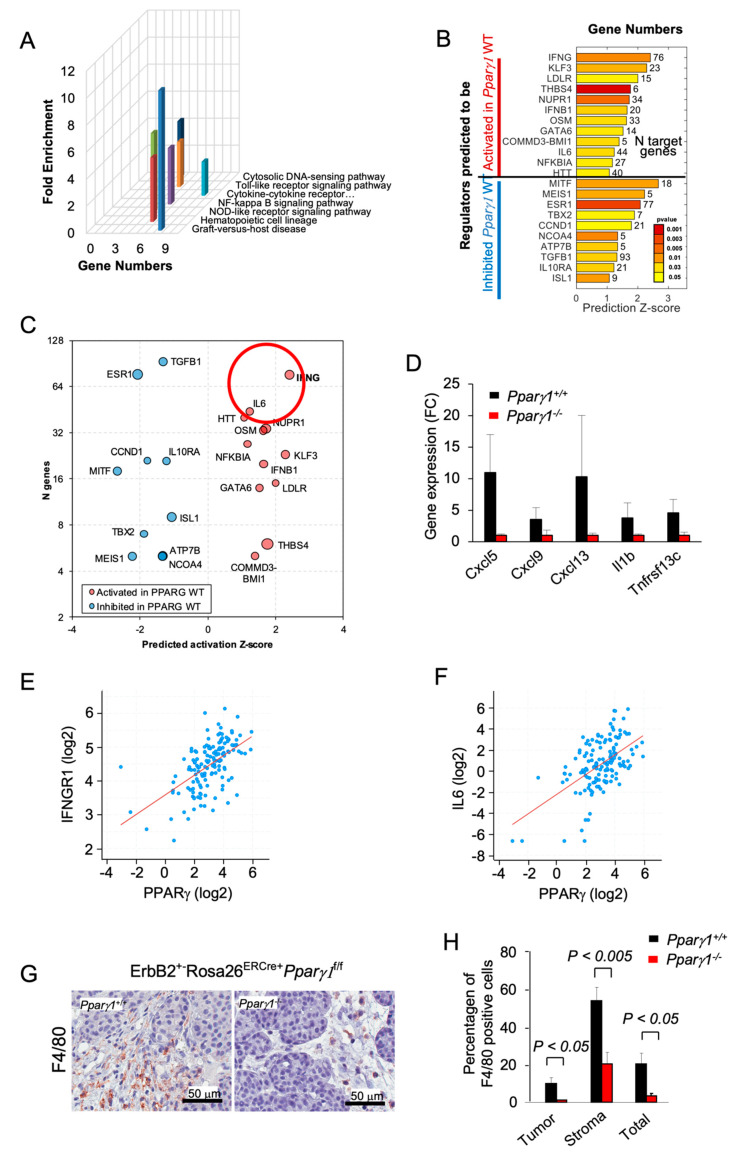
Figure 3.
Deletion of Pparγ1 in MMTV-ErbB2 mammary tumors reduces gene expression of signaling via cytokine/chemokine and growth factor pathways. (A). KEGG pathway analysis gene expression from tumors of ErbB2 mammary GEMM with inducible Pparγ1 deletion showing mean-fold change in levels of expression. (B,C). Ingenuity Pathway Analysis (IPA) performed for mammary tumors using “Upstream Regulators” option. The results show regulators with a significant number of changed known targets and Z-score for the predicted change of the regulator’s activation state. In (B) Z-scores are shown as bars with p-values shown in color scale from red (best p-value) to yellow. In (C) results are represented by bubble plot of Z-scores vs. Number of genes (n) with size proportional to log10(p-value) and color indicating predicted increased (red) or decreased (blue) activity of the regulators in Pparγ1+/+ vs. Pparγ1−/− mammary tumors. Lower p-values are related to a more significant of number of changed targets of a regulator, and a higher Z-score indicates a better evidence of activation or inhibition of regulator’s activity based on the targets direction of change. (D). Gene expression for cytokines/chemokines upregulated by Pparγ1 from KEGG analysis. (E,F). Correlative gene expression analysis in breast cancer samples from The Metastatic Breast Cancer Project (Provisional, February 2020) between Pparγ and IFNG and IL-6 identified in (C). Correlation between PPARγ expression and expression of IFNGR1 (n = 136, Pearson 0.57, p = 17.13 × 10⁻¹⁴), and IL6 (n = 136, Pearson 0.55, p = 6.1 × 10⁻¹³) is highly significant. (G). Immunohistochemical staining for the tissue-associated macrophages with F4/80. (H). with data shown as mean ± SEM for n = 6 separate tumors.

